
What’s up NavigationTraders?!
Welcome to another lesson from NavigationTrading.
In this tutorial, I want to talk to you about trading Iron Condors during a market crash. Iron Condors are one of the core strategies that we use at NavigationTrading and I get a lot of questions from members about how this strategy performs if the market crashes. To help answer this question, we did a pretty significant back tested study.
Trading Study Criteria
The symbol we’re looking at is SPY, the S&P 500 ETF.
We’re looking at entering these trades with 45 days to expiration. We typically like to enter trades anywhere from 30-60 days left, so 45 days will work for us.
We closed our winners at 40% of max profit just like we always do.
And, we took a look at two different timeframes. We looked at the most recent five years. Obviously, with the market trending upwards over those five years, that’s a different situation than what we saw in the meltdown between 2007-2009.
CML Option Strategy Back-Tester
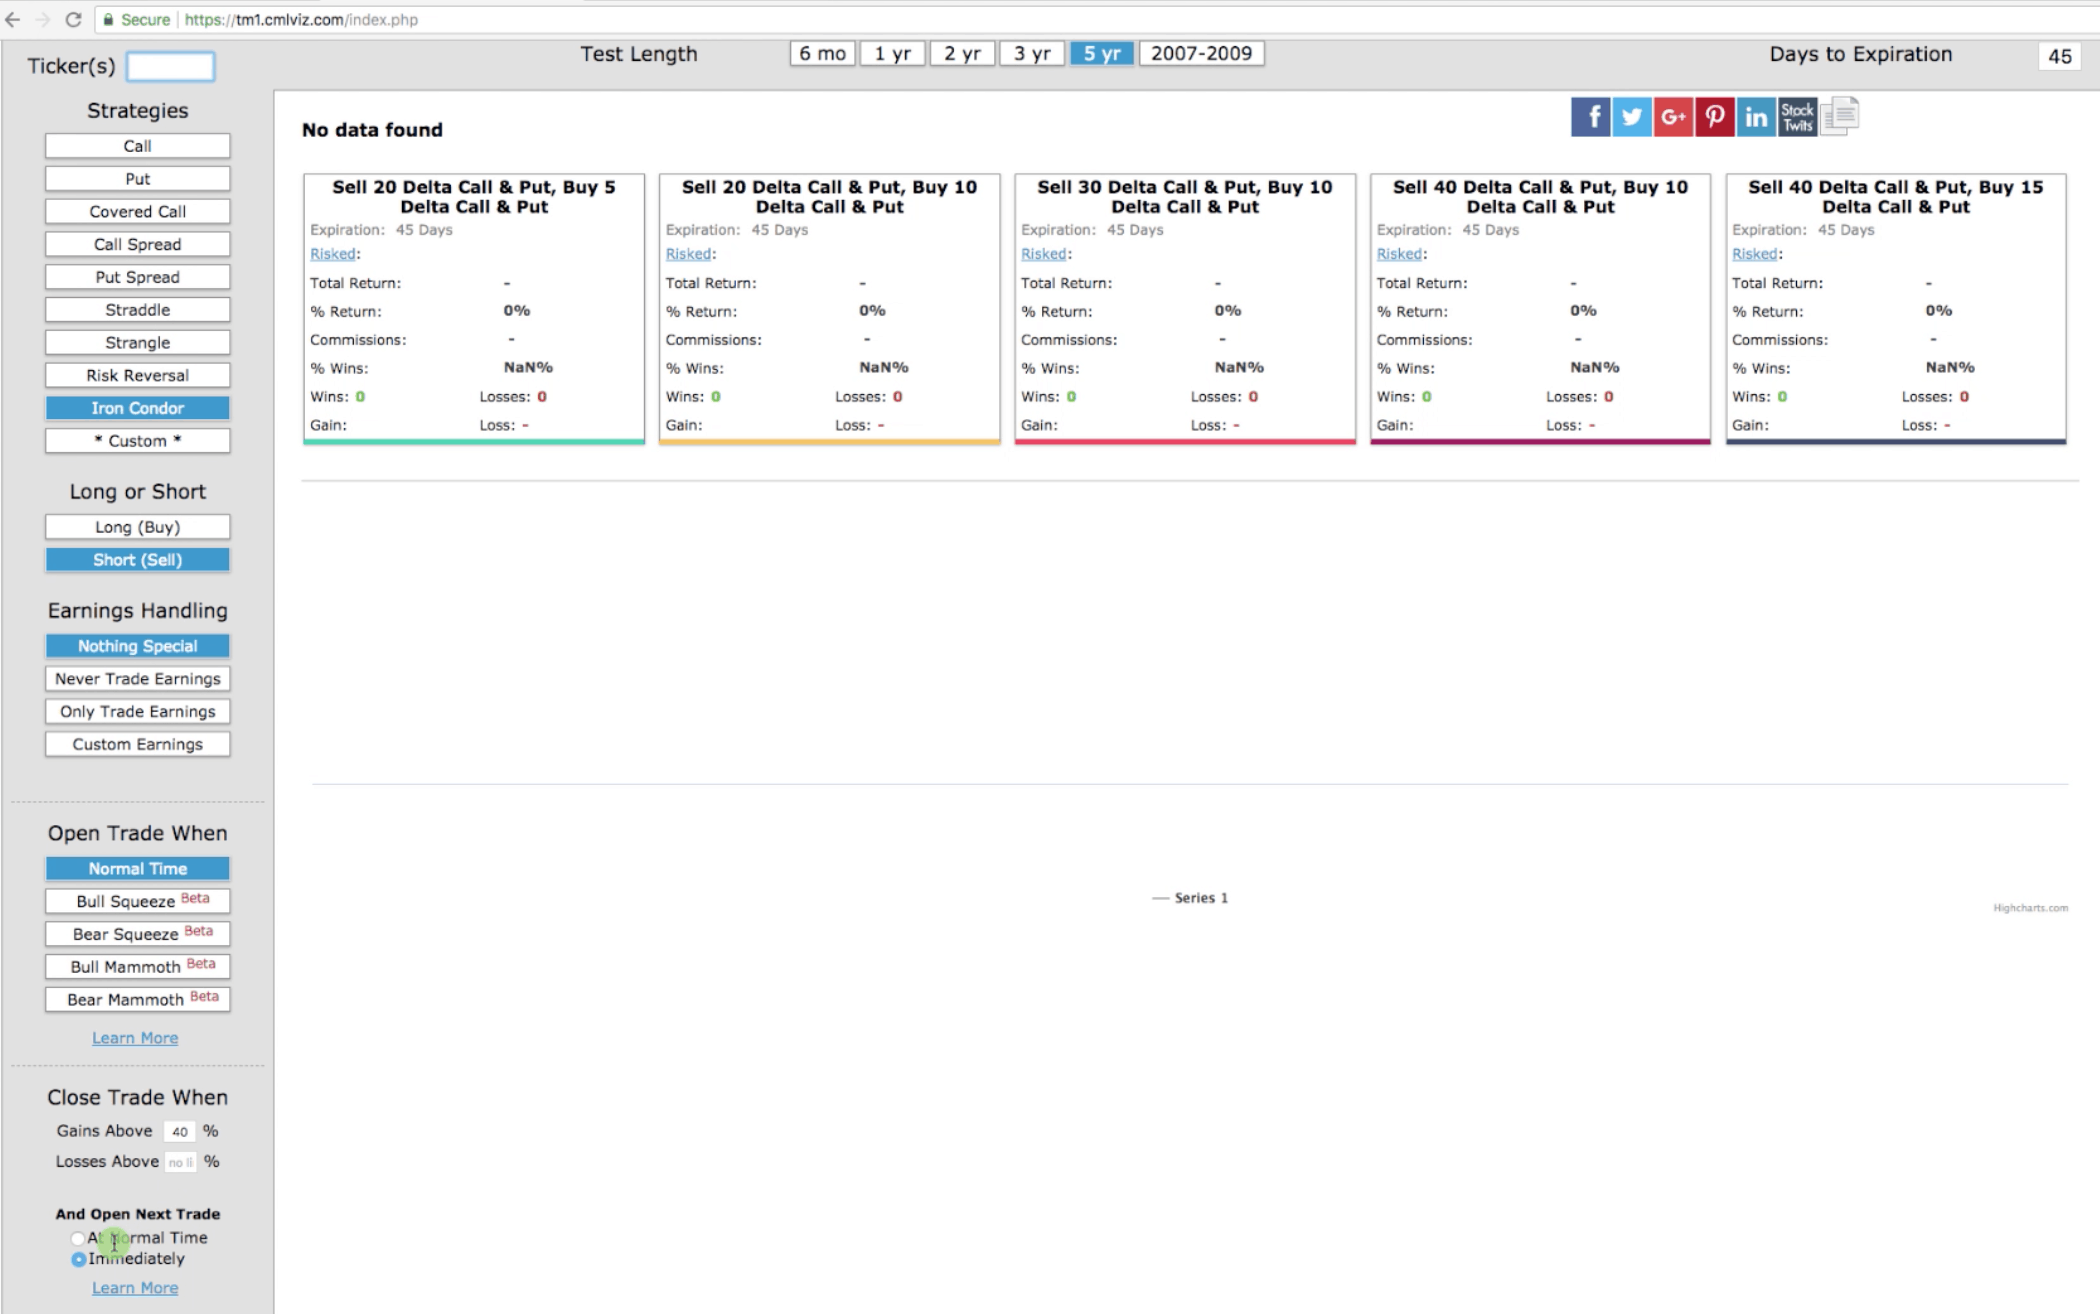
We’ll look at both of these timeframes separately to compare the performance of Iron Condors. Let’s go to the CML Option Strategy Back-Tester. Over on the left sidebar, we’ve got the Iron Condor selected from the “Strategies” section.
In the next section down, we’ve got the “Short (Sell)” option selected, because we’re selling the Iron Condor to open.
Obviously, there’s no earnings, it’s an ETF so just “nothing special” is selected under the “Earnings Handling” section.
We’re opening it at “normal time” and we’re closing the trade when we have gains at 40% of max profit.
Then, we selected “Immediately” under “And Open Next Trade”. That way, once the trade is closed, immediately we open a new trade. See the selections we’ve made to the left sidebar in the graphic below.
Options Trading Selections

I want to start with the five year back tested study. I think people have a general idea, that if we’re putting on Iron Condors and the market is trending higher, that means implied volatility is typically contracting. So, that’s going to benefit an Iron Condor.
The performance in what we call a bullish market has performed very well, and that’s no surprise. Below, you’ll see several different deltas that we put up just to give you an idea. We sell in the 20-30 delta range, and we buy at the 5-10 delta range.
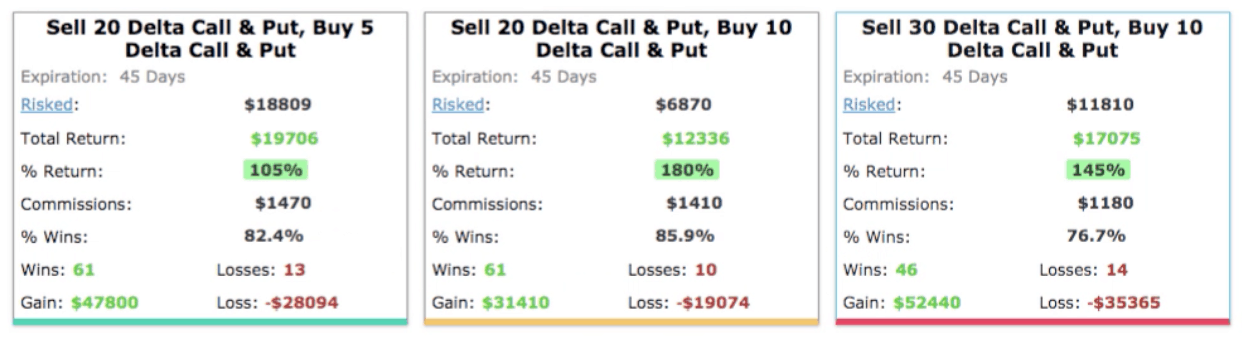

Just for reference, here are selling the 40 delta and buying the 10, as well as, selling the 40 delta and buying the 15.
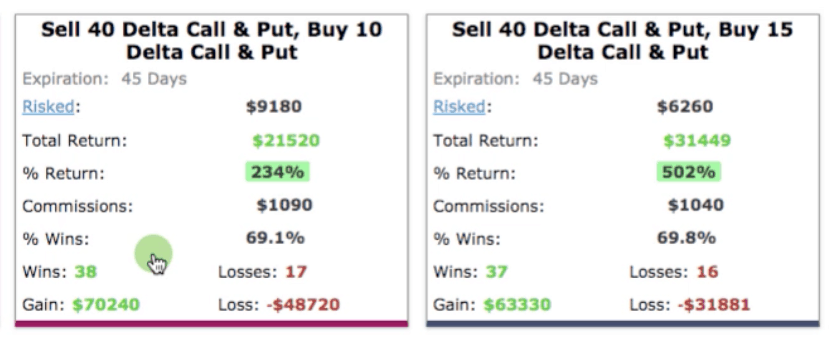

As you can see, the tighter or the closer to the money you got, you actually performed better. But, the 20-30 delta range is typically the area that we play in; that’s our sandbox. We sell the 20-30 delta and buy a further out of the money strike.
Iron Condor Performance Against The Market
Over the last five years, you can see the performance has been great. Hovering over the graph area, up at the top, you can see SPY’s stock over that five-year period gained 94.8%.
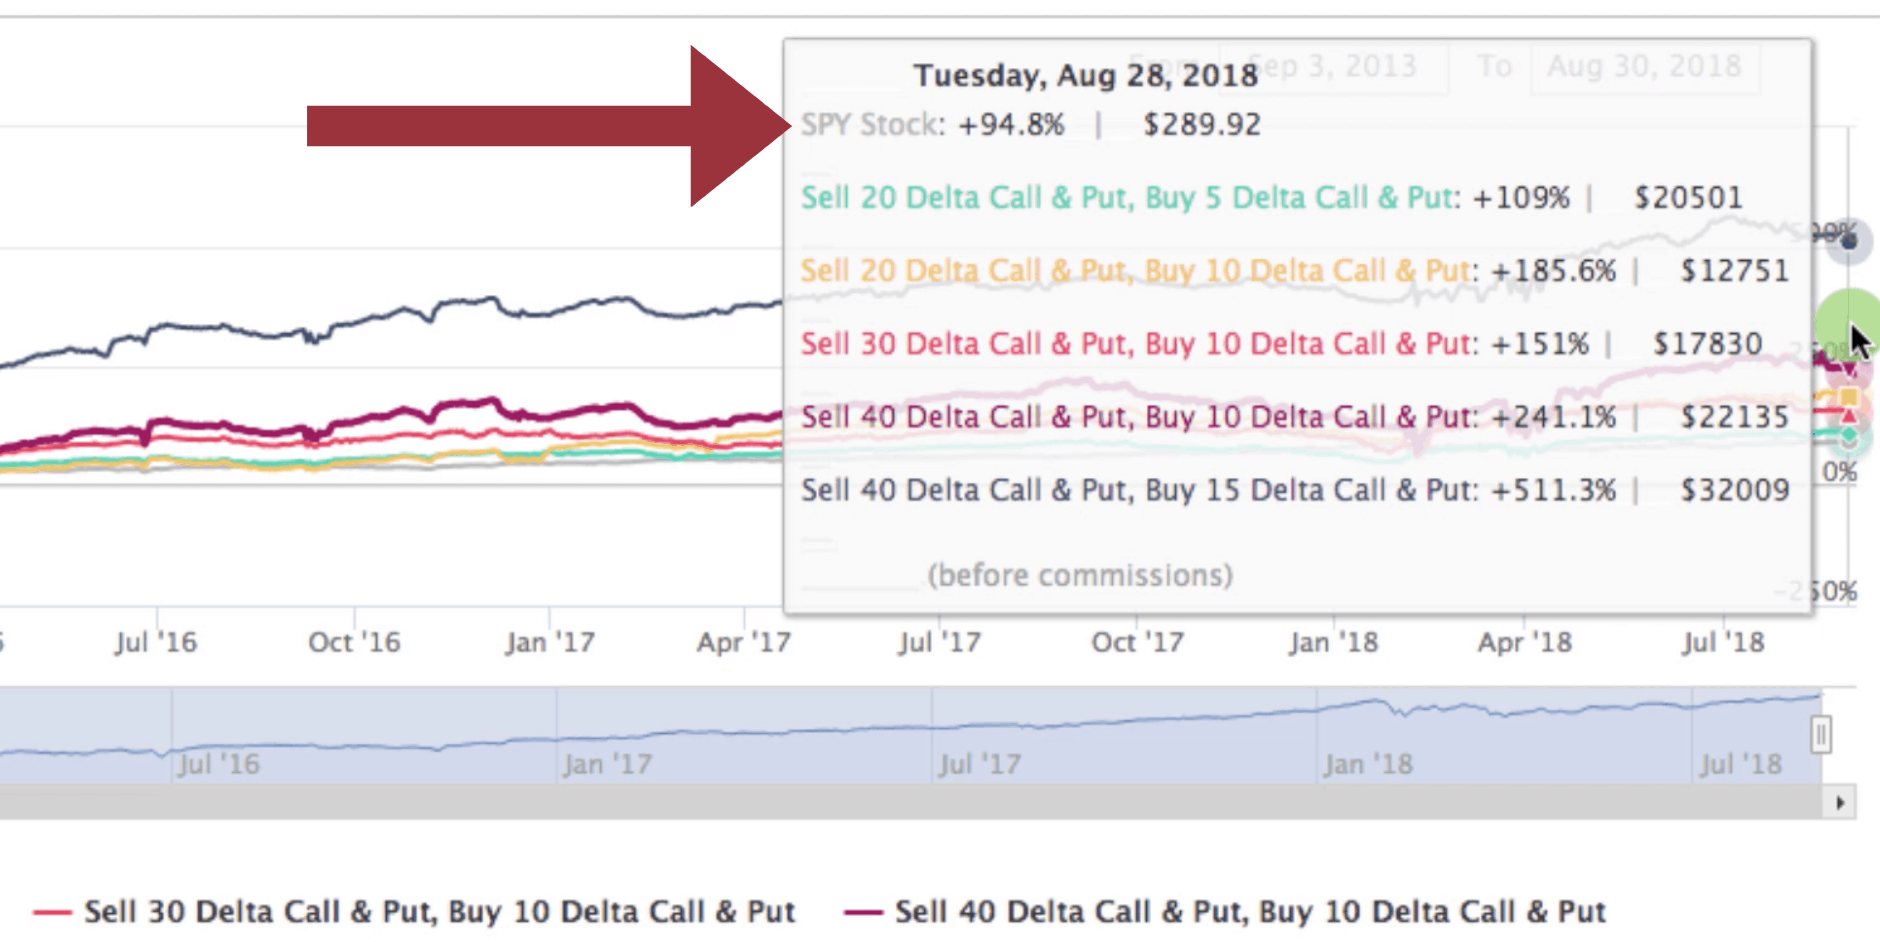

A helpful tip: the graph data is color coded to reference each of the trade boxes above.
Compared to the SPY stock, every single one of these outperformed just buying and holding the SNP 500.
Today, it’s very popular just to invest in index funds. Traders will just buy the S&P 500 because most money manager’s accounts don’t even outperform it. Well, that’s true. However, by just putting on an Iron Condor, as soon as it closes with a gain of 40% of max profit, put on another one, and by doing that very simple strategy, you can beat the pants off of the S&P 500.
Referring back to the graphic above, you can see where we sold the 20 delta and bought the 5 delta, we made over 109%. Where we sold the 20 delta and bought the 10, we made 185%. With selling the 30 delta and buying the 10 delta, made another 151%. And then, with selling the 40 delta and buying the 10 and 15, we have 241% and 511%. So, we’re significantly outperforming just the buy and hold strategy of the S&P 500.
Trade Performance During a Market Crash
I want to take this to another level. We need to test if this strategy will work during a market crash.
To do this, I’m choosing 2007-2009 from the “Test Length” area up at the top of the platform. Within a few seconds, the software populates and gives you an idea of what the performance was during that time.
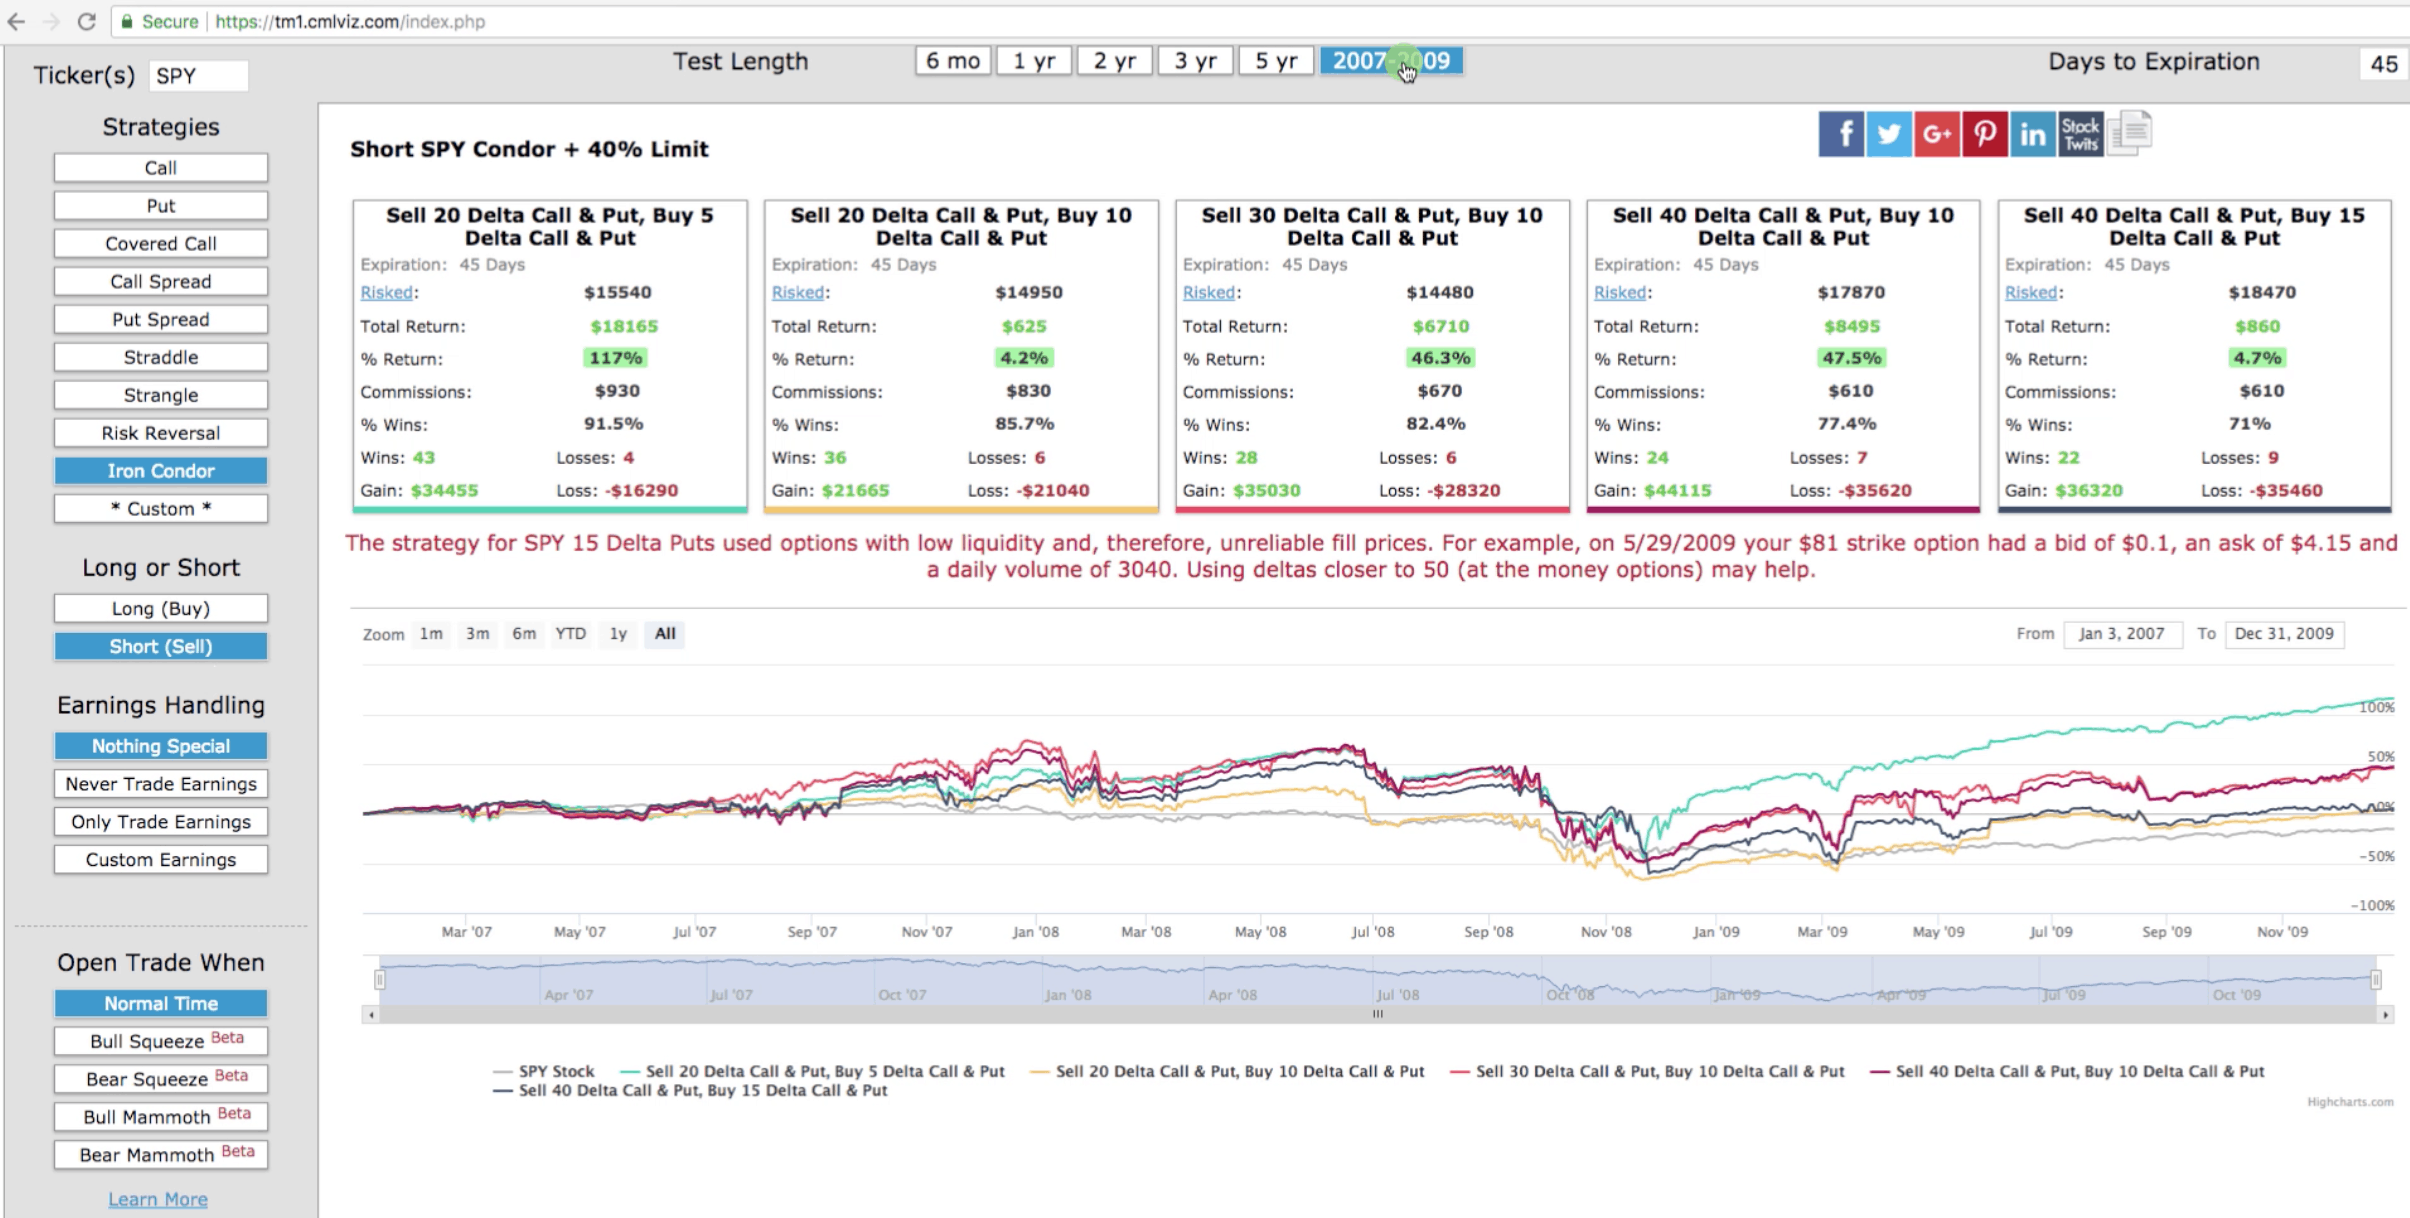

Before I did this back tested study, I would’ve thought performance wouldn’t have been near as good as in a bull market. But, in the period of 2007-2009, one of the biggest market meltdowns that we’ve ever seen, this strategy performed pretty well. Selling the 20 delta and buying the 5, made over 117%. Selling the 20, and buying the 10 basically hit break-even. Selling the 30 delta and buying the 10, made a little over 46%.
But, you also have to compare that to the S&P 500.
We’re trading these Iron Condors on the S&P 500. Everybody likes to use the S&P 500 as a benchmark for performance in the market. So let’s hover over the graph and take a look. I mean, you can see during that period of time, the S&P 500 was down -15.1%.
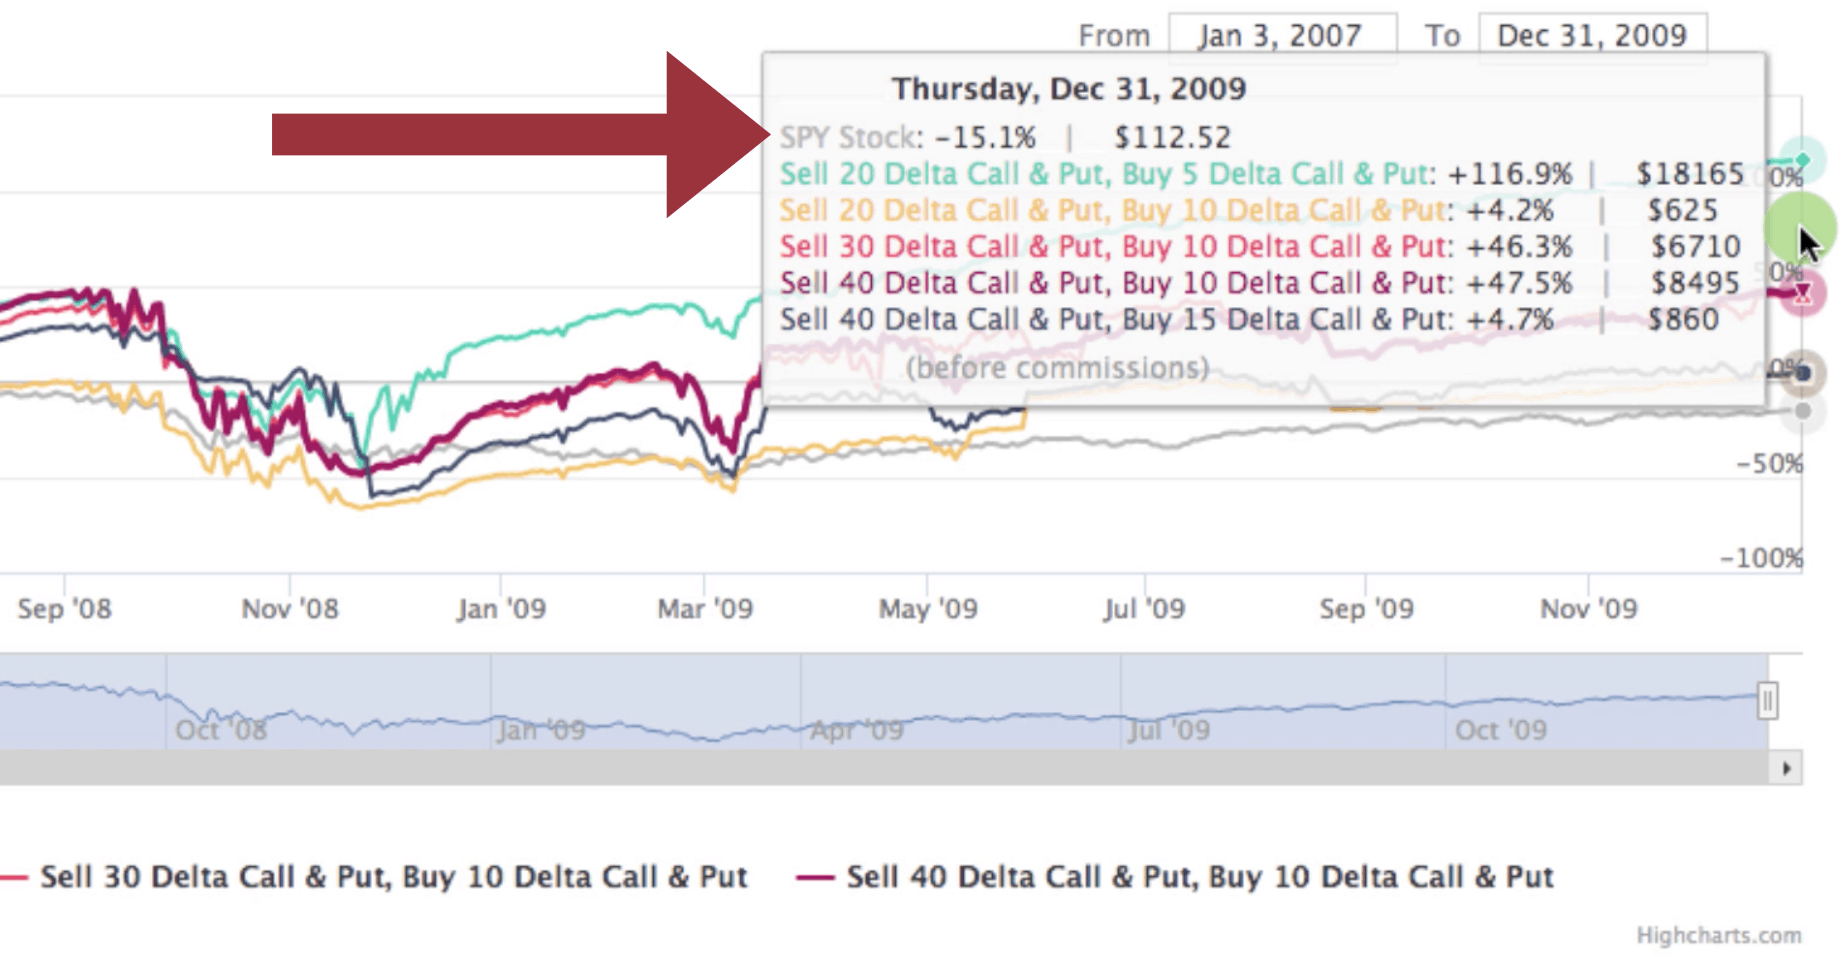

However, regardless of the delta you chose to sell an Iron Condor, you significantly outperformed the S&P 500.
Your returns weren’t extravagant; they weren’t as good as they would be in a bull market. But the bottom line is, if you’re comparing it just to your buy and hold index funds, it kills it. It literally beats the pants off of that along with any other money manager or mutual fund who’s trying to actively manage funds to outperform the S&P 500. It beats those too.
Summary – Iron Condor Trade Options
I hope this lesson was helpful in understanding that this strategy is viable in a bull market. It’s viable in a market crashing environment like we saw in 2007, 2008, and 2009. It’s just a strategy that can be used through any type of market cycle.
Remember, we’re not even filtering this for high implied volatility. I’ve been talking to Ophir (the creator of the CML Back-Tester) and there’s been talks about adding the implied volatility filter, so that we could say, “let’s only put on Iron Condors when implied volatility is high”. I think what you’d see the returns would be even better.
But this is just putting on Iron Condors anytime. Implied volatility is high, it’s low, it doesn’t matter. We’re just putting one on, taking it off, putting on another one, taking it off and so forth. That’s the power of this Back-Tester!
If you’re interested in getting access to the CML Option Back-Tester, we do have an agreement with CML. Normally, the price for this program is $149 a month. Ophir and his team have been awesome to work with and they have given NavigationTraders a huge discount, over 40%, and it’s just $89 a month.
The price will continue to go up as he pours in additional resources and value into the software. But once you lock in, you’re locked in for the life of your membership. To sign up, you can just go to https://cmlviz.com/register/navigationtrading-cml-trademachine-pro/.
Again, I hope this lesson was helpful!
Happy Trading!
-NavigationTrading Team

Follow