Hey NavigationTraders!
I just wanted to take some time to introduce you to a new tool we’ve recently created that is now available in your Member’s Area. Once you log in, you’ll see a new addition among our Indicator and Watch List links. It’s the NavigationTradeTracker! If you click on it, it’s going to download a spreadsheet.
The goal of the NavigationTradeTracker is to help you track your adjusted trades. After you’ve done some adjustments and rolls, sometimes it can be overwhelming because trade platforms like thinkorswim and tastyworks don’t track your trades after the portion of them have been closed.
That’s what this tool is here to help you do!
Once you get familiar with the tool and start using it, please send us any feedback you have. This is version 1.0, and we’re sure it will evolve over time as we get feedback and different comments from our members. So, PLEASE let us know what you think 🙂
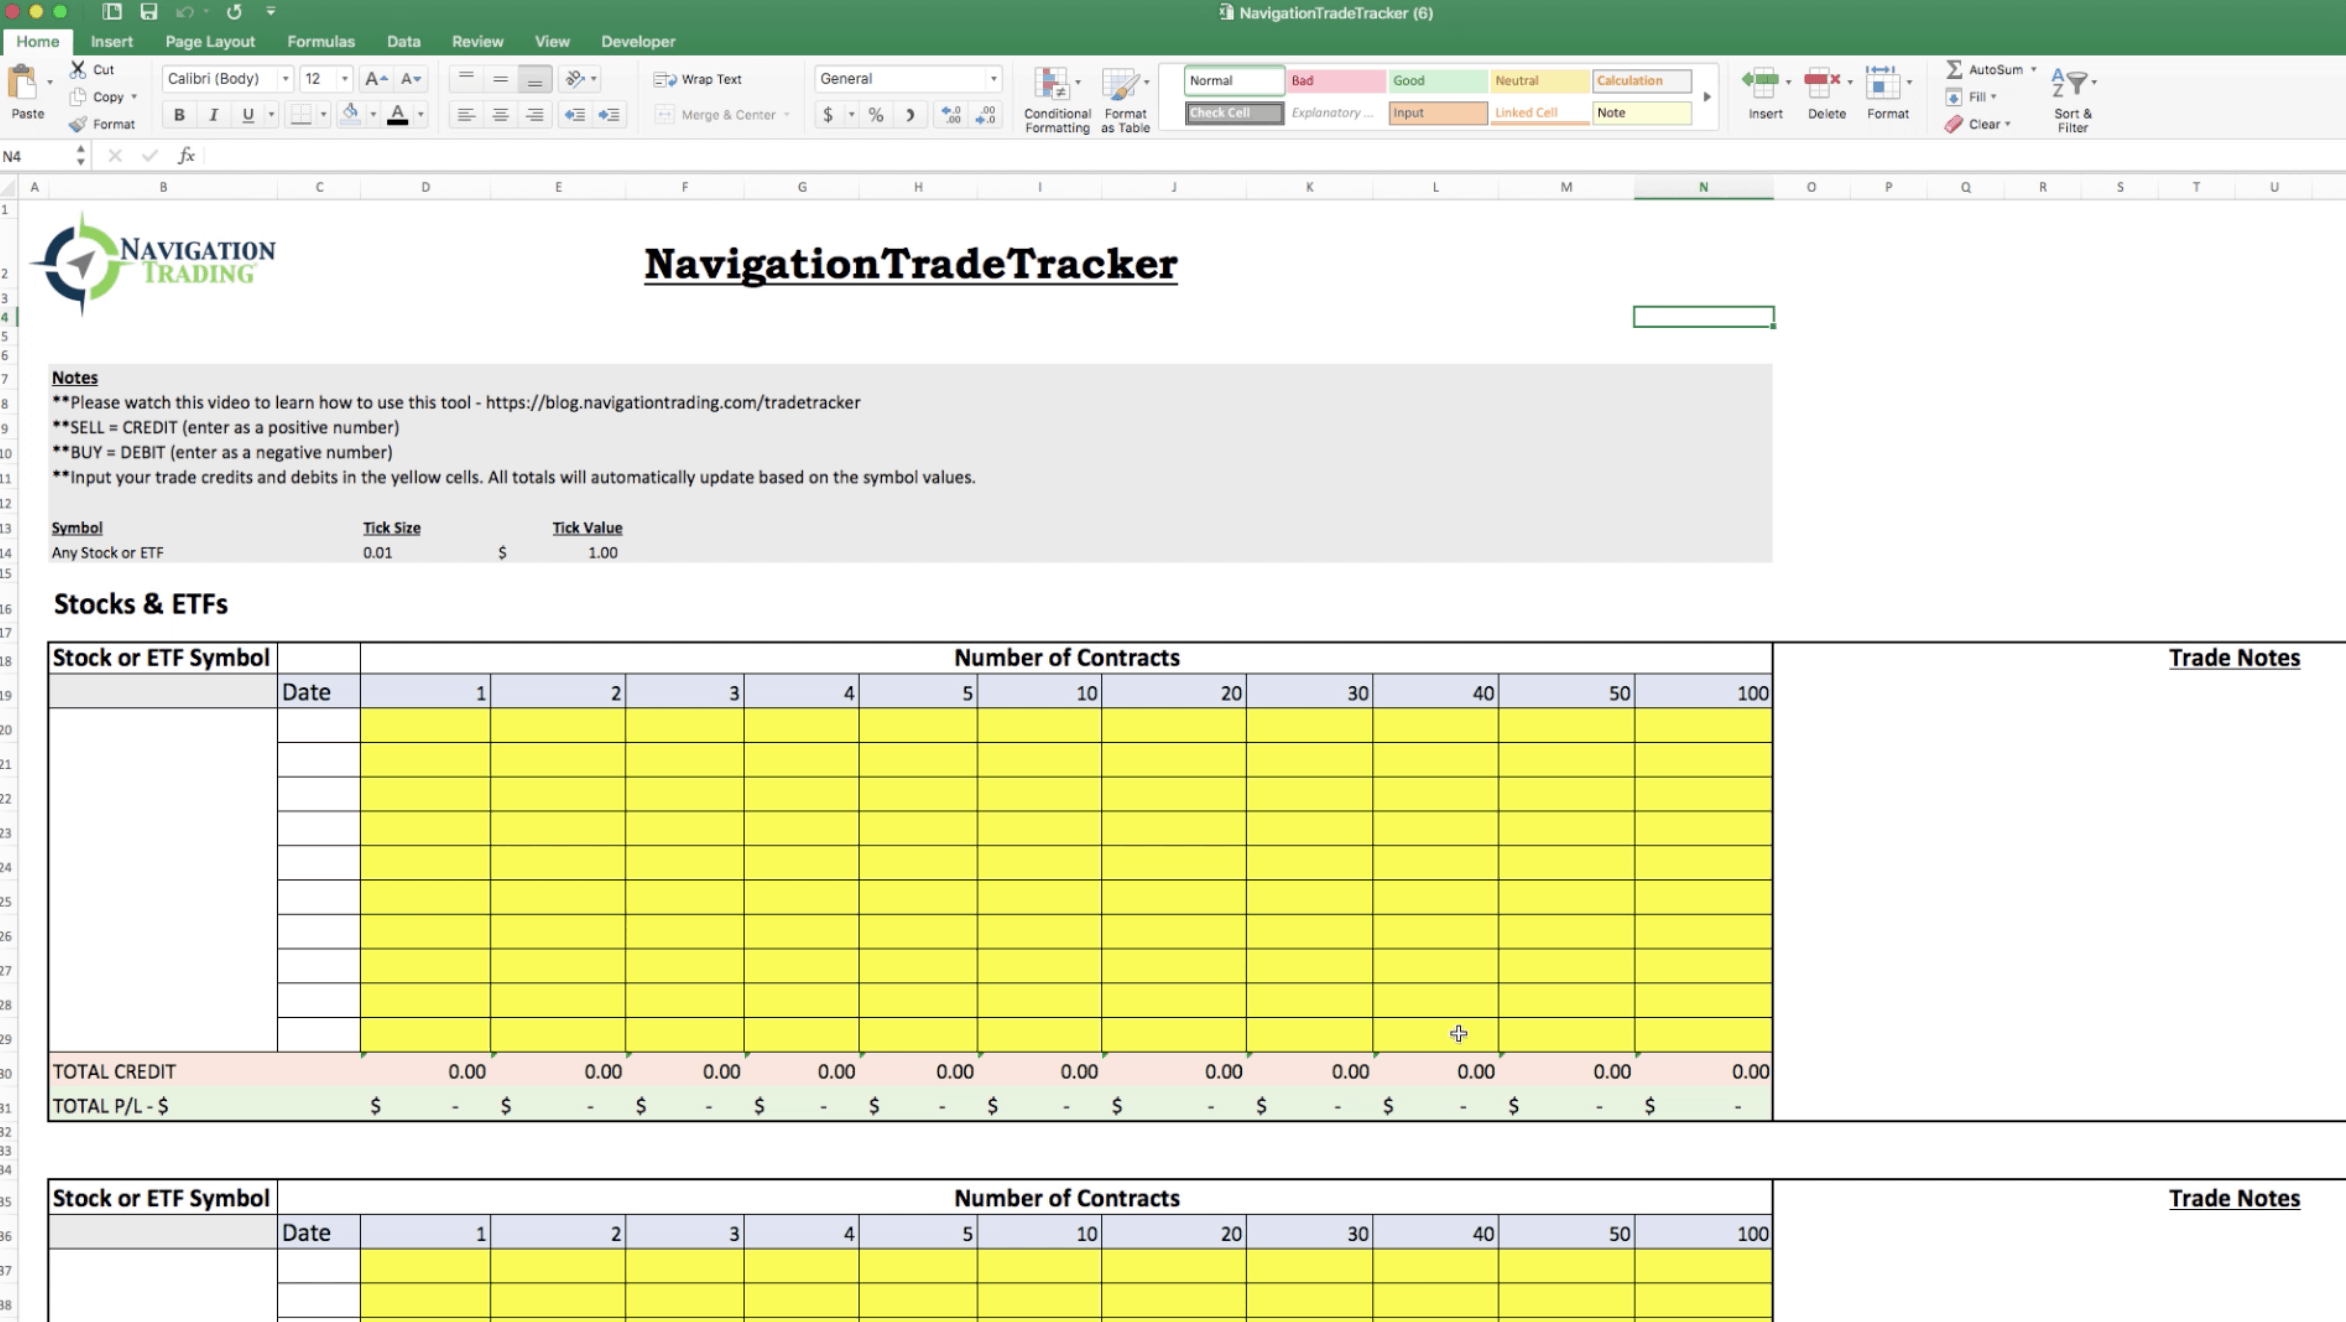
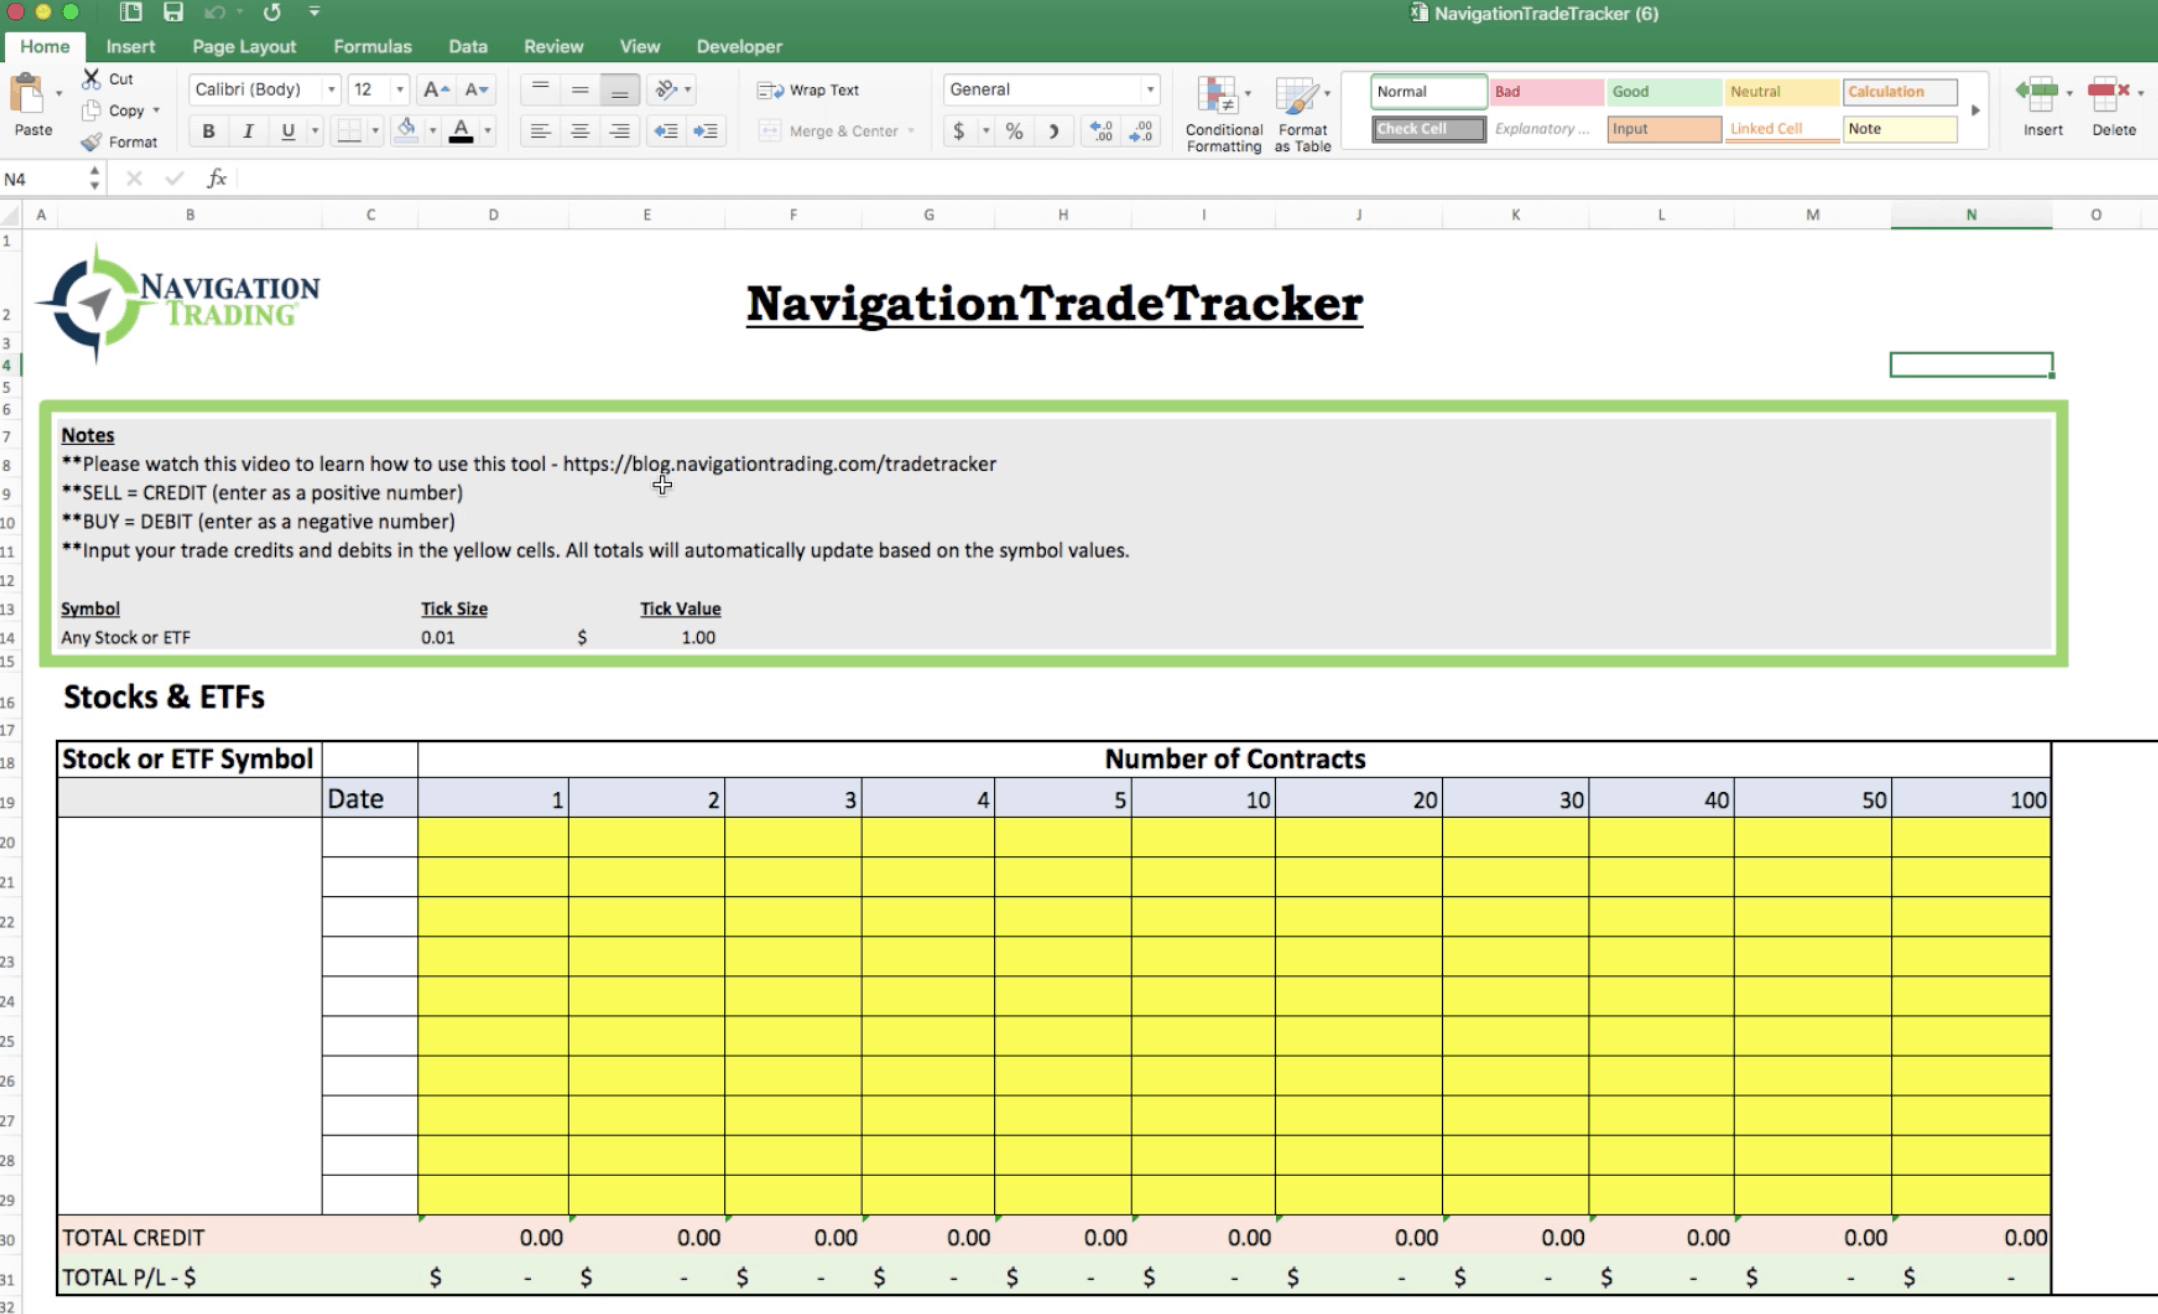
Let’s get started! I’m going to go over the main features and show some examples of how you would use this tool. To begin, you’ve got some notes up at the top of the spreadsheet. This is pretty much what they say:
- Please watch this video to learn how to use this tool – navigationtrading.com/tradetracker (The video the note is referencing is at the beginning of this blog post. This tutorial is just a readable option if you don’t want to watch the video).
- When you’re inputting your values into the sheet…If you SELL an option, that equals a credit, and you’re going to enter that as a positive number.
- When you buy something, that’s a debit, and you’re going to enter that as a negative number on the sheet. (I’ll show you exactly what this means later in the tutorial).
- Input your trade credits and debits in the yellow cells below and all the totals will automatically update based on the symbol values (Hopefully we’ve made this very simple for you and took as much of the work out of it as possible. All you have to do is enter your trade values and it should do the calculations for you).
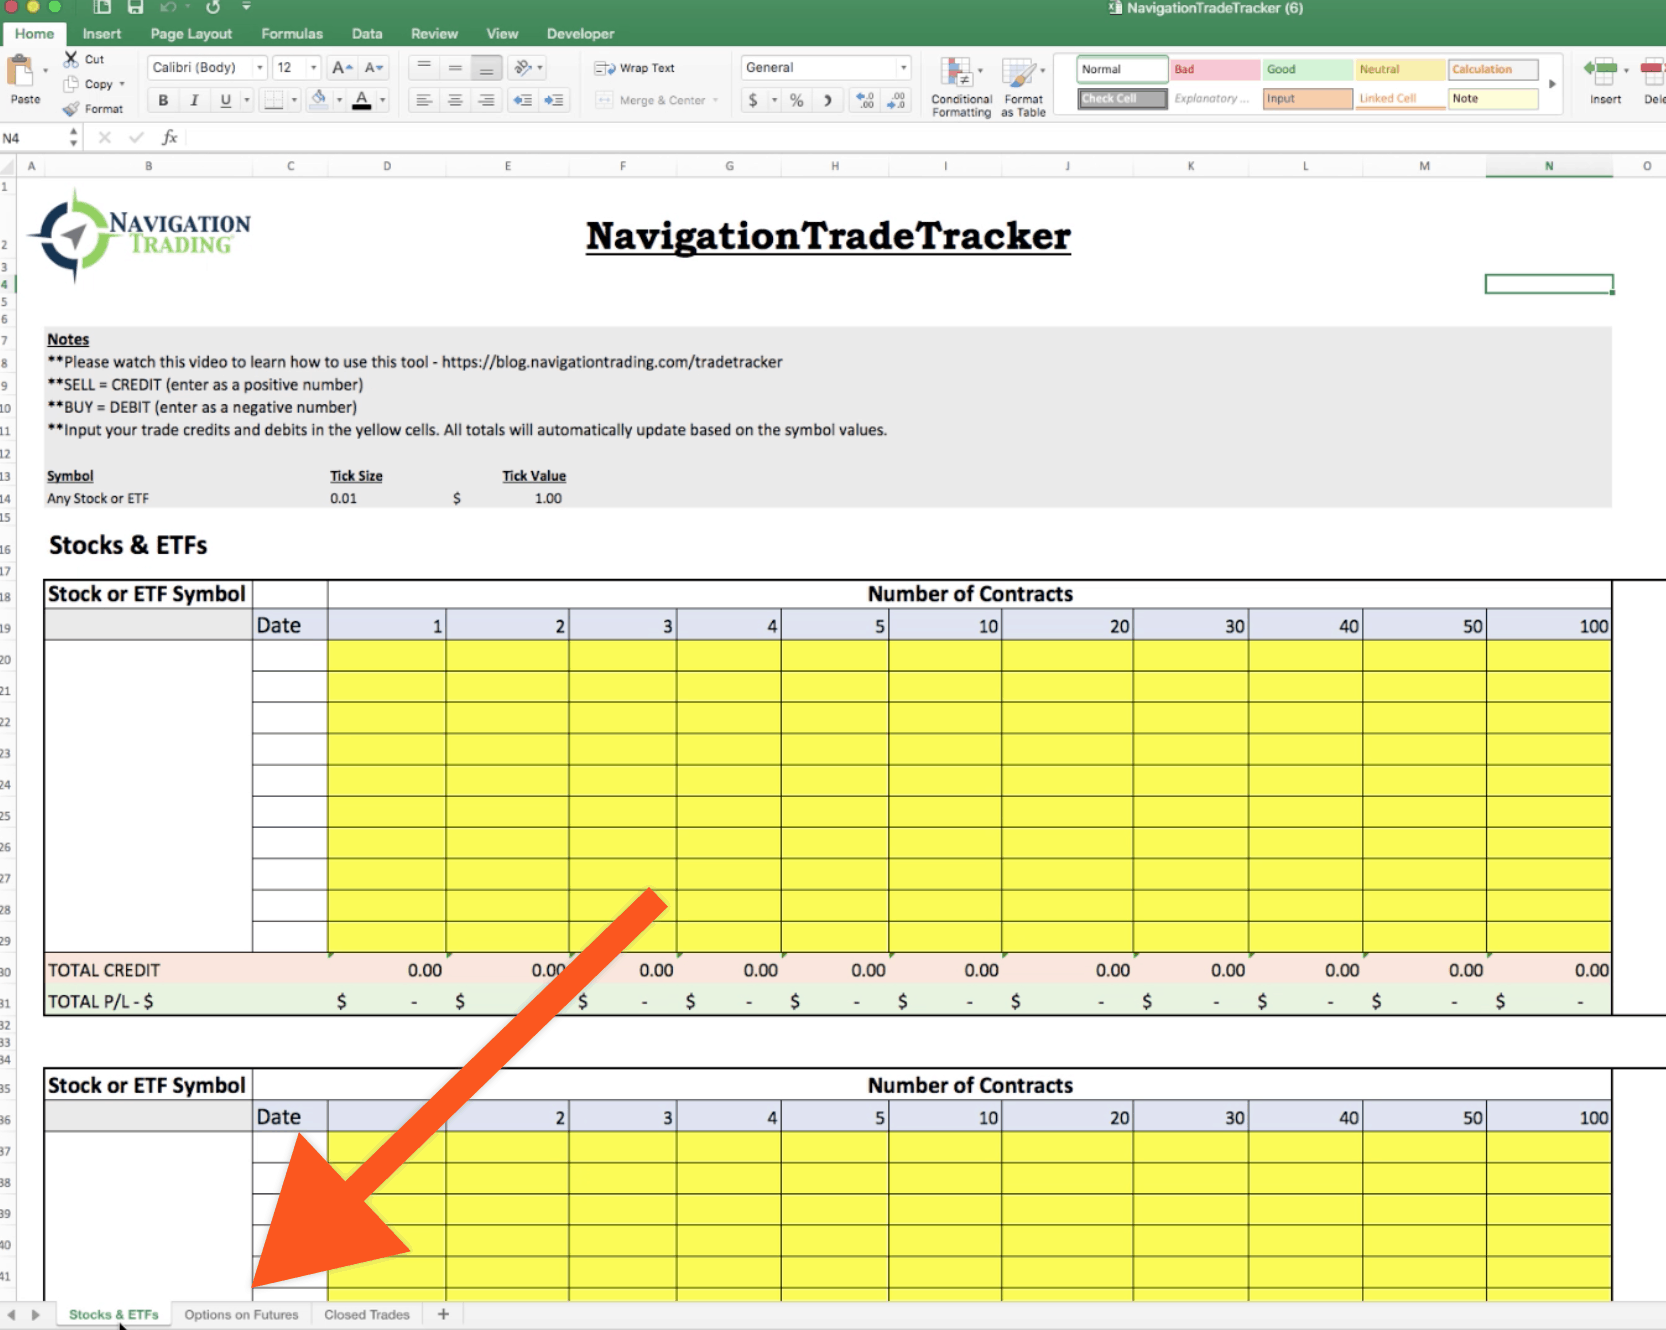
At the bottom of the sheet, you’ll notice there are a few different tabs. One is Stocks and ETFs, another is Options on Futures, and then one is for Closed Trades.
Stocks and ETFs NavigationTradeTracker Example
Let’s start with Stocks and ETFs. I’m going to do an example for you on an open trade that we have on that we’ve made several adjustments on. Let’s look at the example trade on EWW. This is a trade that we’ve had on since June 21st of 2018.
On the Stocks & ETFs tab, just enter the symbol into the spreadsheet under the “Stock or ETF Symbol” column. This is just for your reference. Then you can put the date of each trade adjustment. In this case, the first trade was on 6/21/18. That’s just for your reference as well. Really, all you have to do is enter your values in the yellow cells.
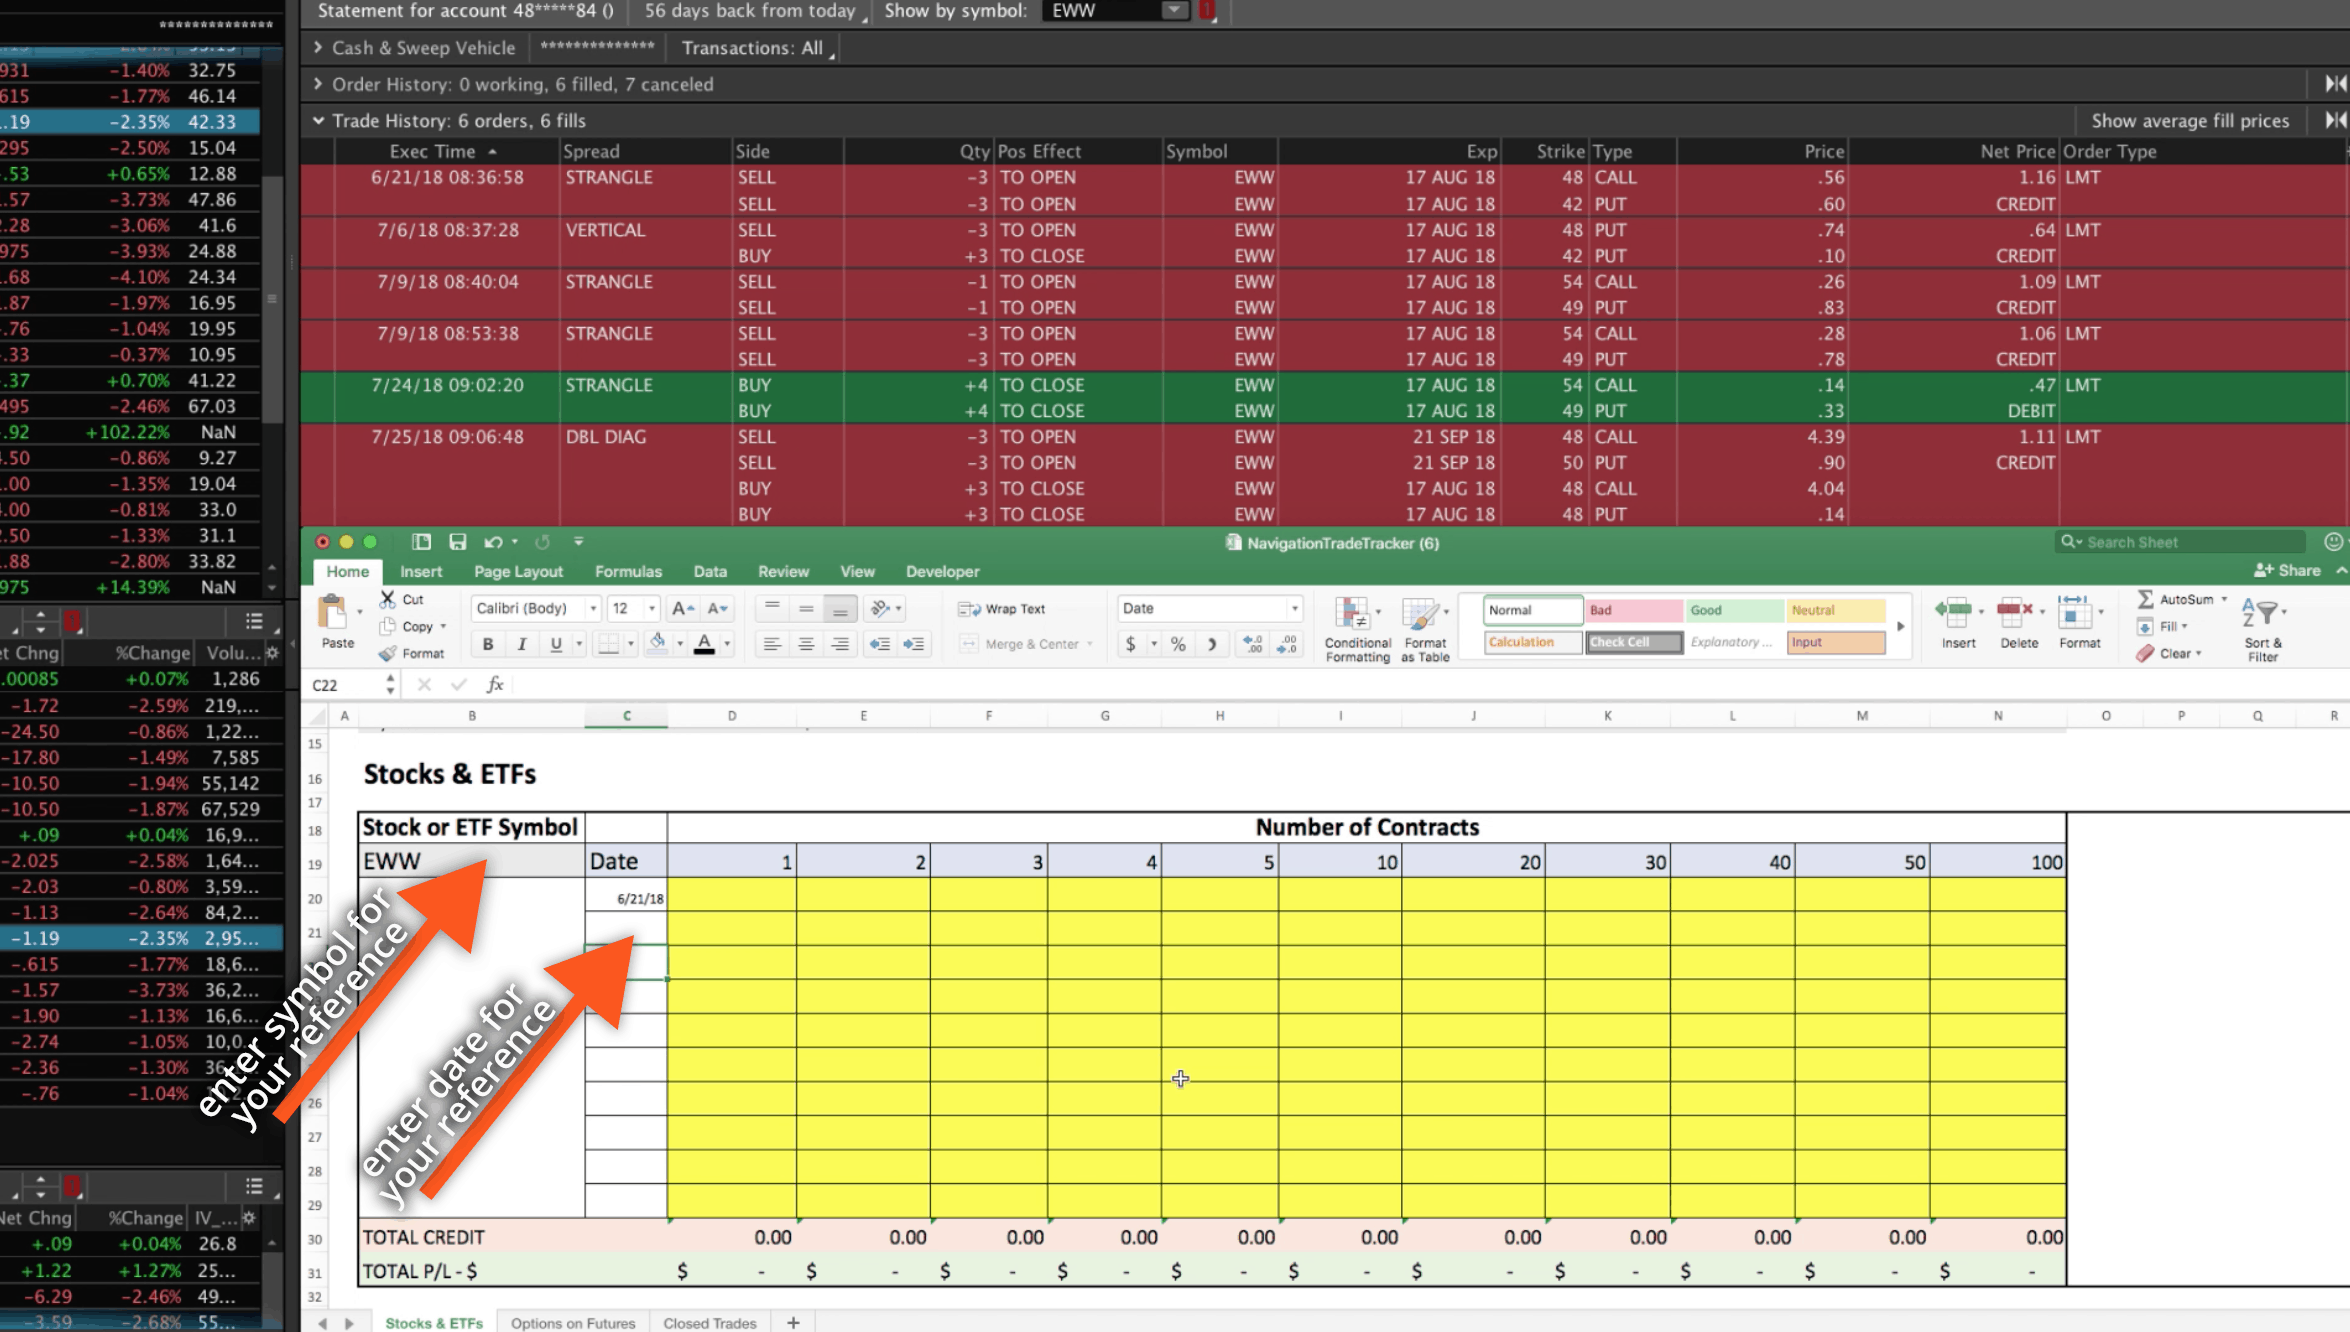
When we first started this trade on 6/21/18, we sold a strangle. We did this for three contracts, and we took in a credit of $1.16. You can see that we’ve built out several columns for the number of contracts. Depending on the number of contracts you’re trading, you can just use the column that applies to you. In this case, we’re doing three, so we’ll enter in a credit of 1.16 under the column for 3 contracts. It’s entered as a positive number because it’s a credit.
On 7/6/18, we did a roll, and we took in another credit of 64 cents.
The next trade was on 7/9/18 we sold another strangle for $1.06. We’ll enter that amount into the spreadsheet under the four contracts column, since we used four contracts on this piece of the trade.
Next, we bought the strangle back and we paid a debit. We bought it back for 47 cents and that was our strangle with four contracts. We’ll enter -0.47 because it’s a debit and you have to add that minus sign in front.
Lastly, we did a roll, but all you have to understand is that it’s either a debit or a credit. In this case, it was a credit of $1.11. This was done with three contracts. We can go back to our three contract column and enter 1.11.
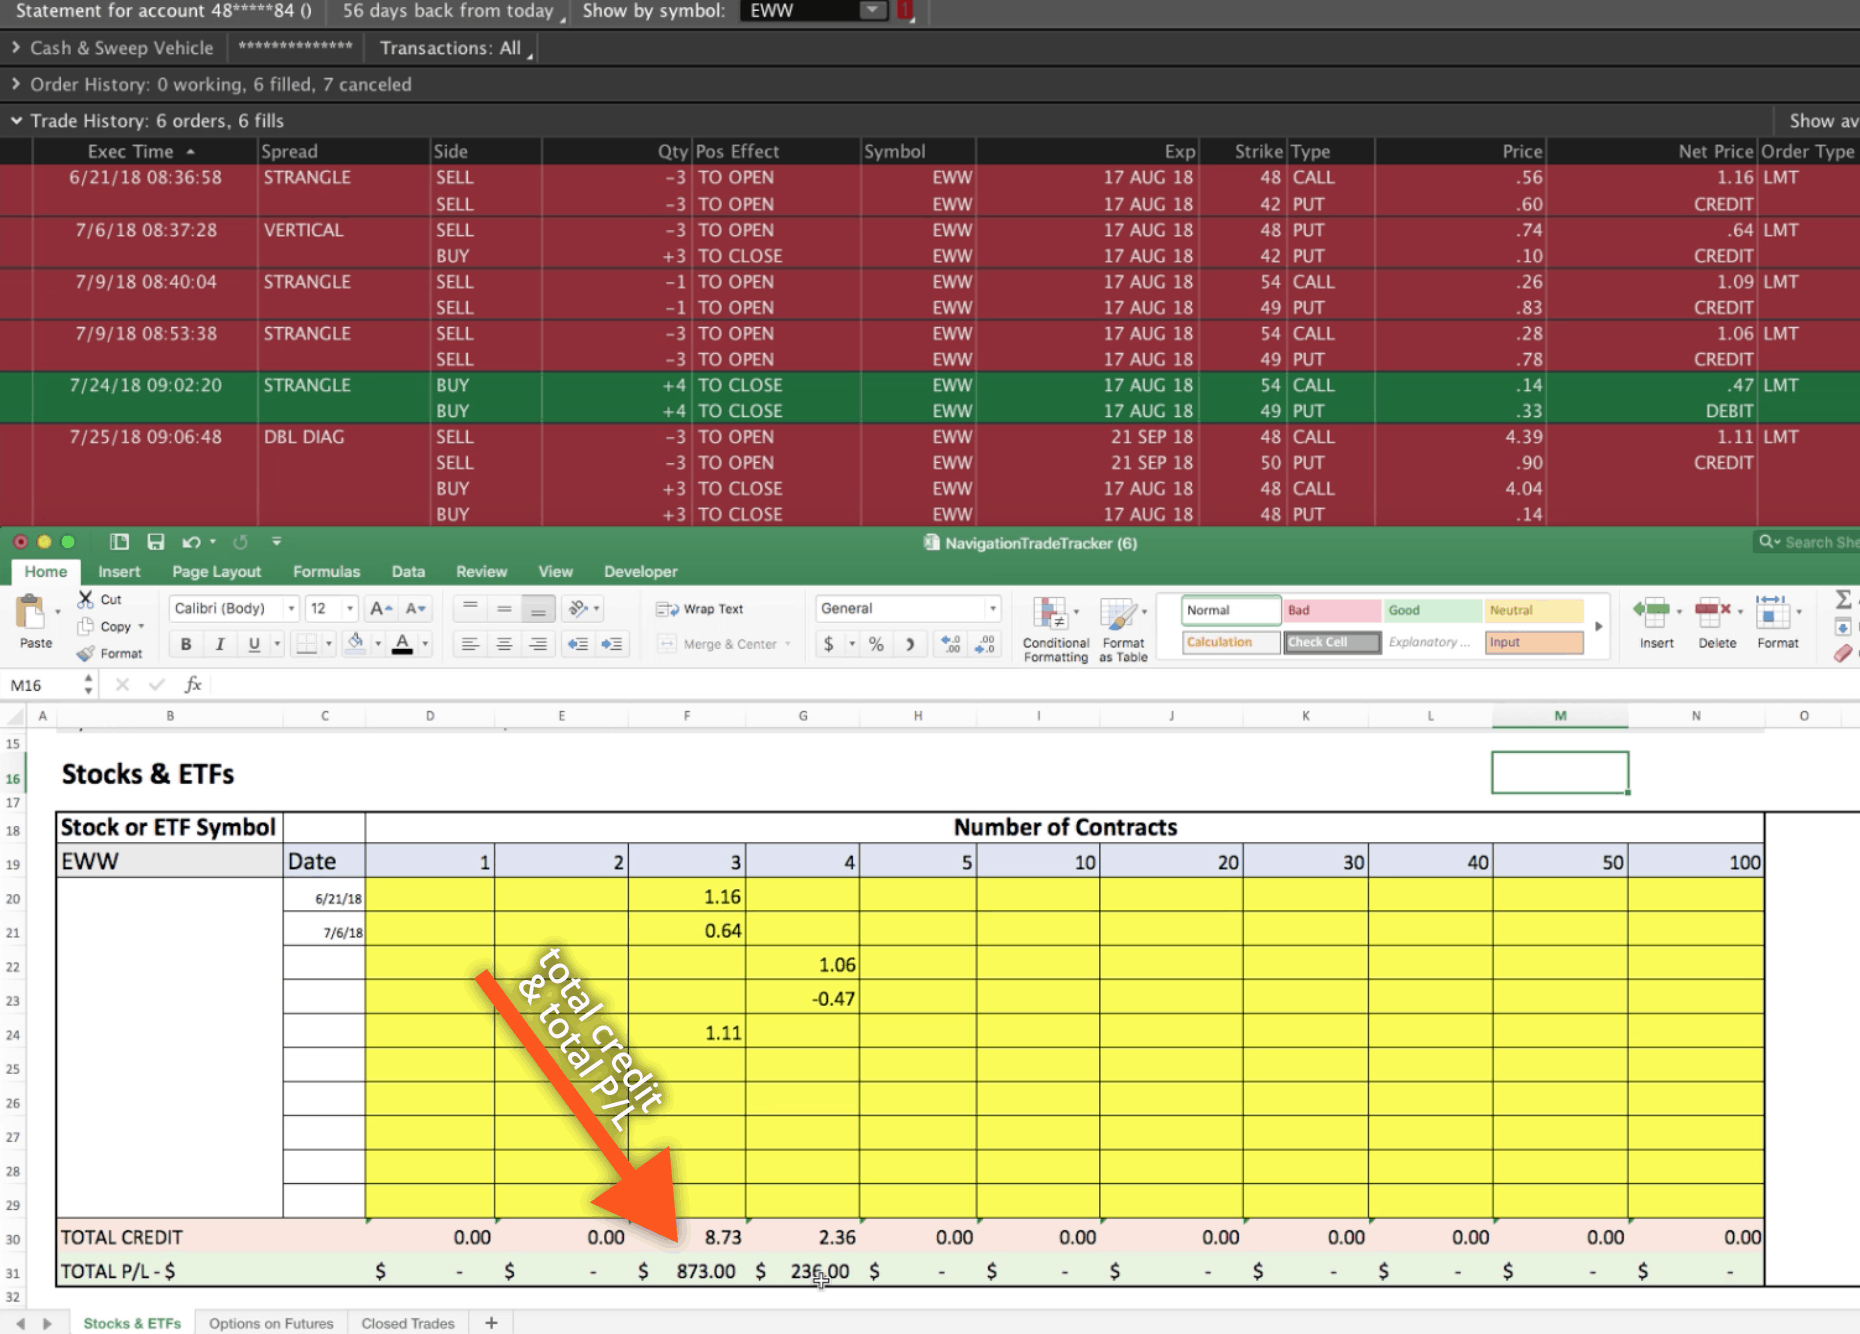
You’ll see at the bottom your total credit is 8.73 on the three-contract piece, and 2.36 on the four-contract piece. The total P/L from a dollar standpoint is $873 on the three contracts, and $236 on the four contracts.
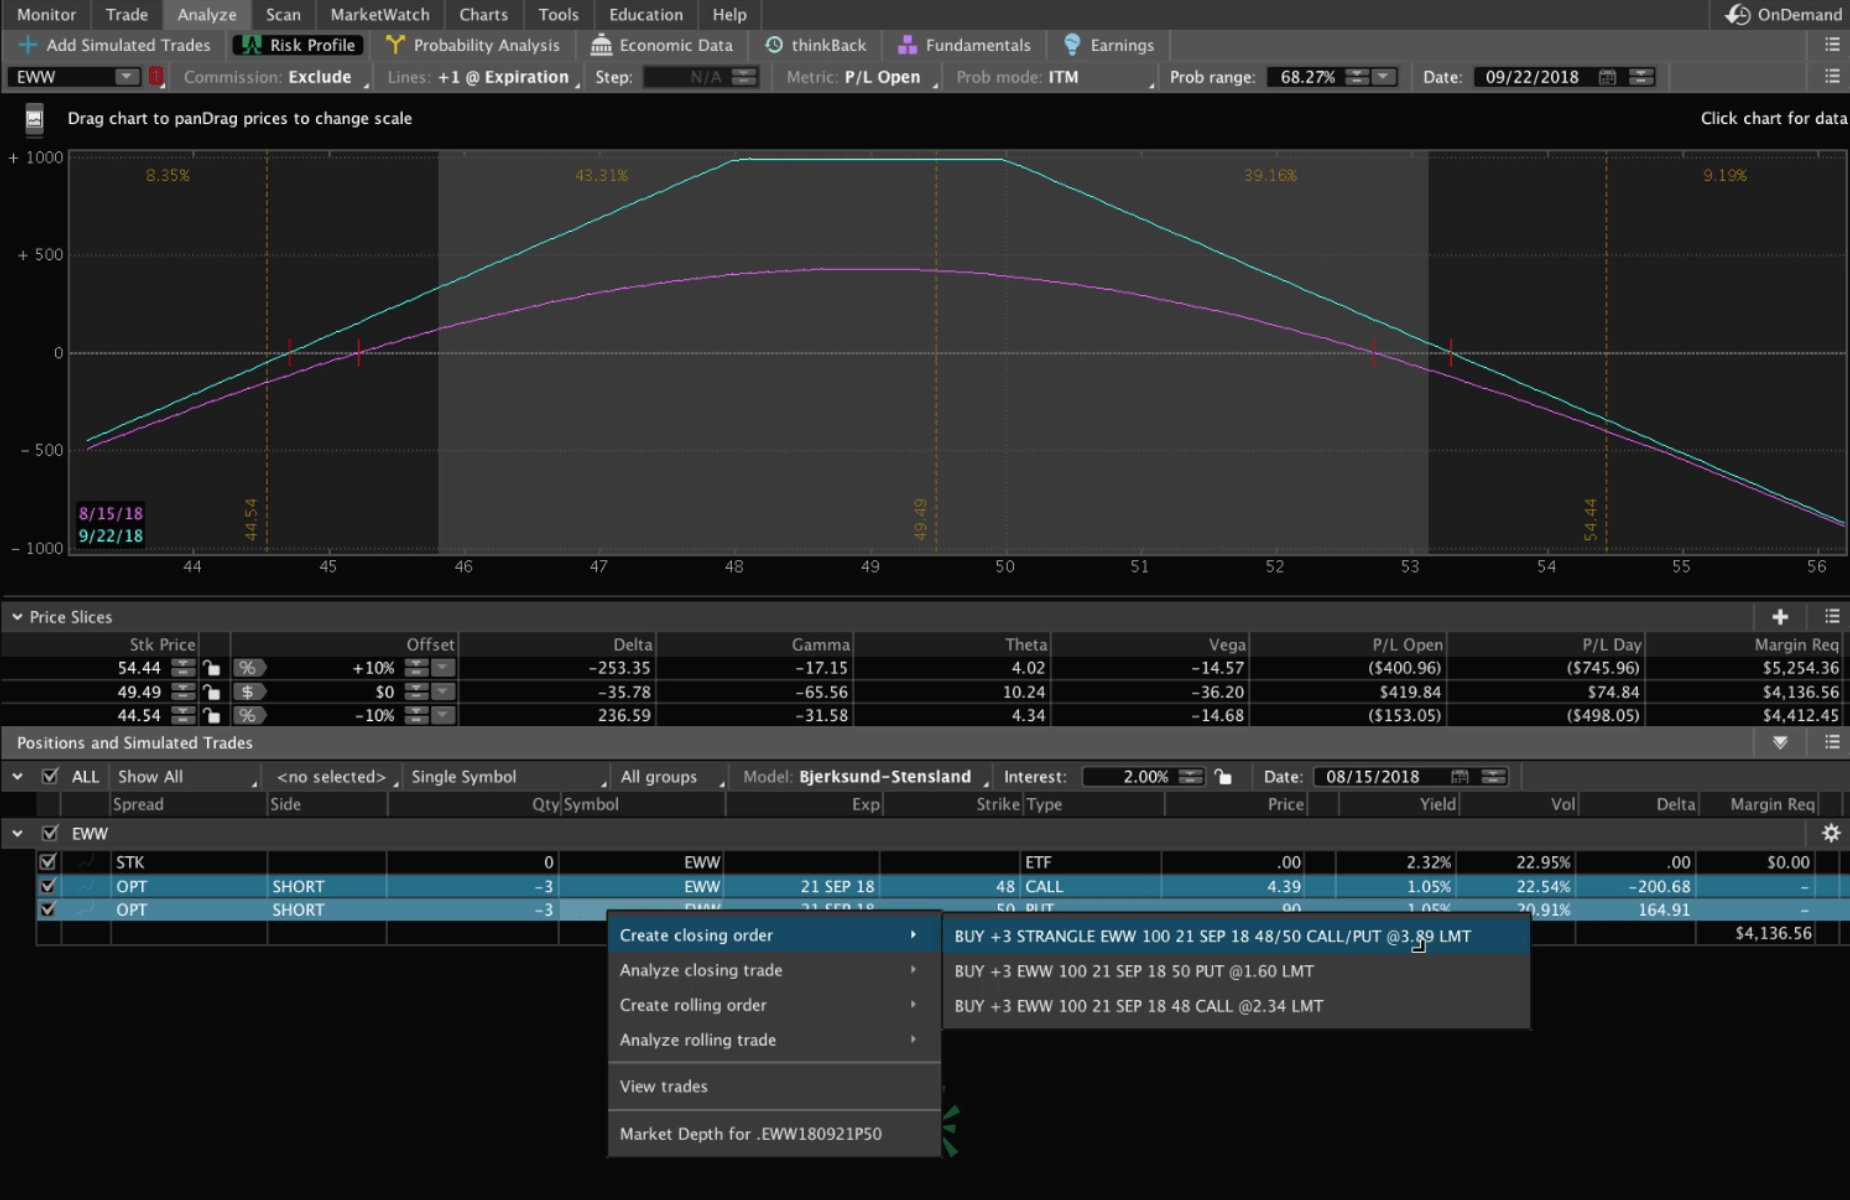
Now, in this example, we’re still in the trade, so you also have to take that into consideration. To get an idea of where we’re at on this remaining piece, we can just highlight the trade and act like we’re going to close it. Right click, select “Create closing order”. You can see if we were going to close this out right now, we would close it out for about $3.89.
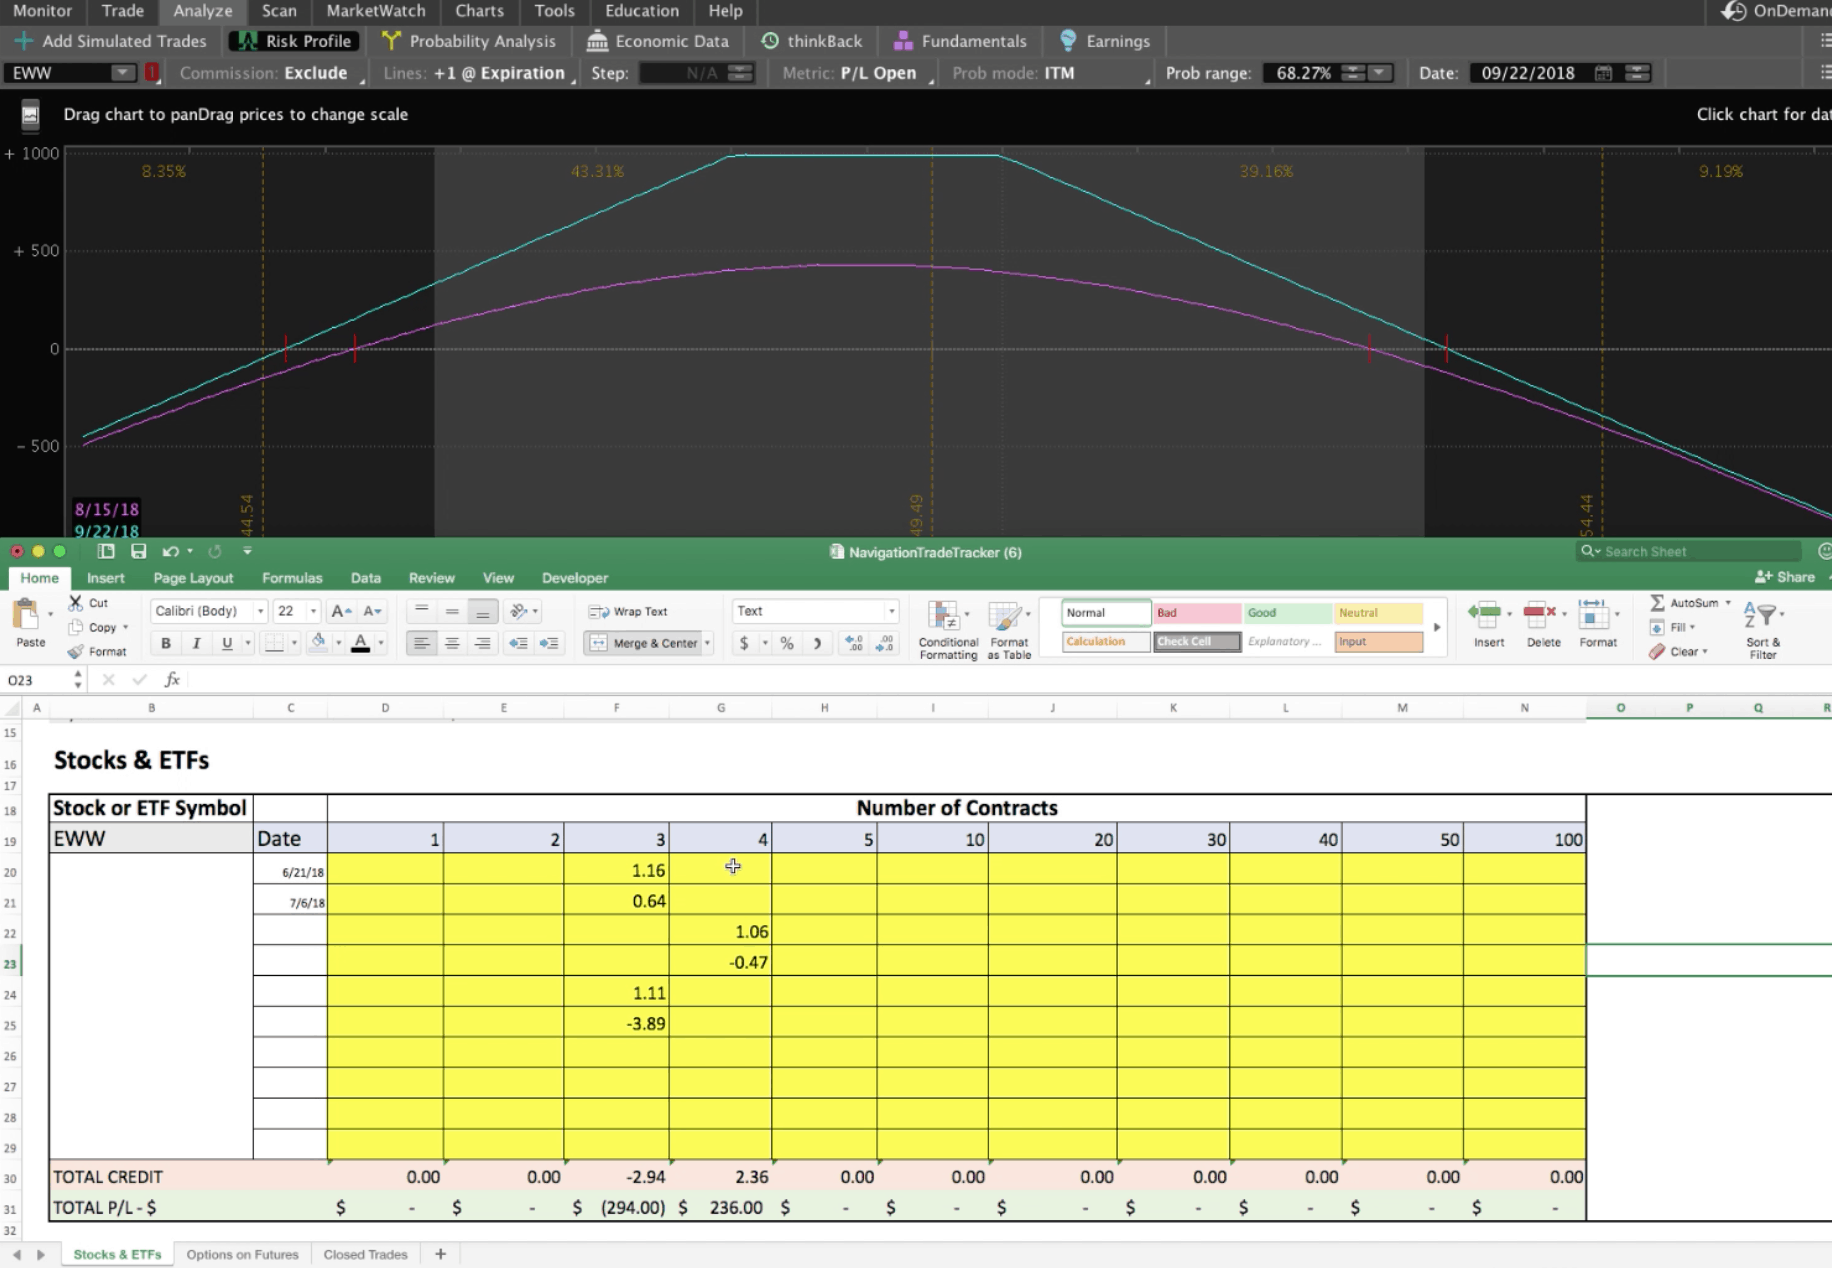
Let’s just go ahead and enter that into the sheet just to get an idea of where we are. That would be a debit because are buying it back. So we’d put -3.89. What you’ll see is that on the three-contract piece, we’re negative $294 currently, and on the four-contract piece, that’s already closed out, and we made $236. Put those together, and we’re down slightly on the trade, which is part of the reason that we’re still in the trade. We’re waiting some more theta to decay, and some more time to pass until we get into a profitable position.
More Features
Obviously, all stocks and ETFs have a tick size of one penny, which translate into a tick value of a dollar. We’ve done the heavy lifting by giving you some different contract options. If you’re trading six contracts, you can add another column in the chart with six contracts and continue to monitor and manage. We have put 10 different NavigationTradeTracker charts in this spreadsheet, so that if you have 10 different trades on at a time, you can just keep them separate and use this sheet as your tracking device.
We’ve also added a section for trade notes over to the right of each chart. You can use this area as a trading journal to document what was happening in your trade. Let’s say you already got out of this trade, so maybe you say, “Closed trade early. Missed out on massive profits. Next time, I will listen to NavigationTrading. They are awesome.” 😆 That’s where you can document things and take notes.
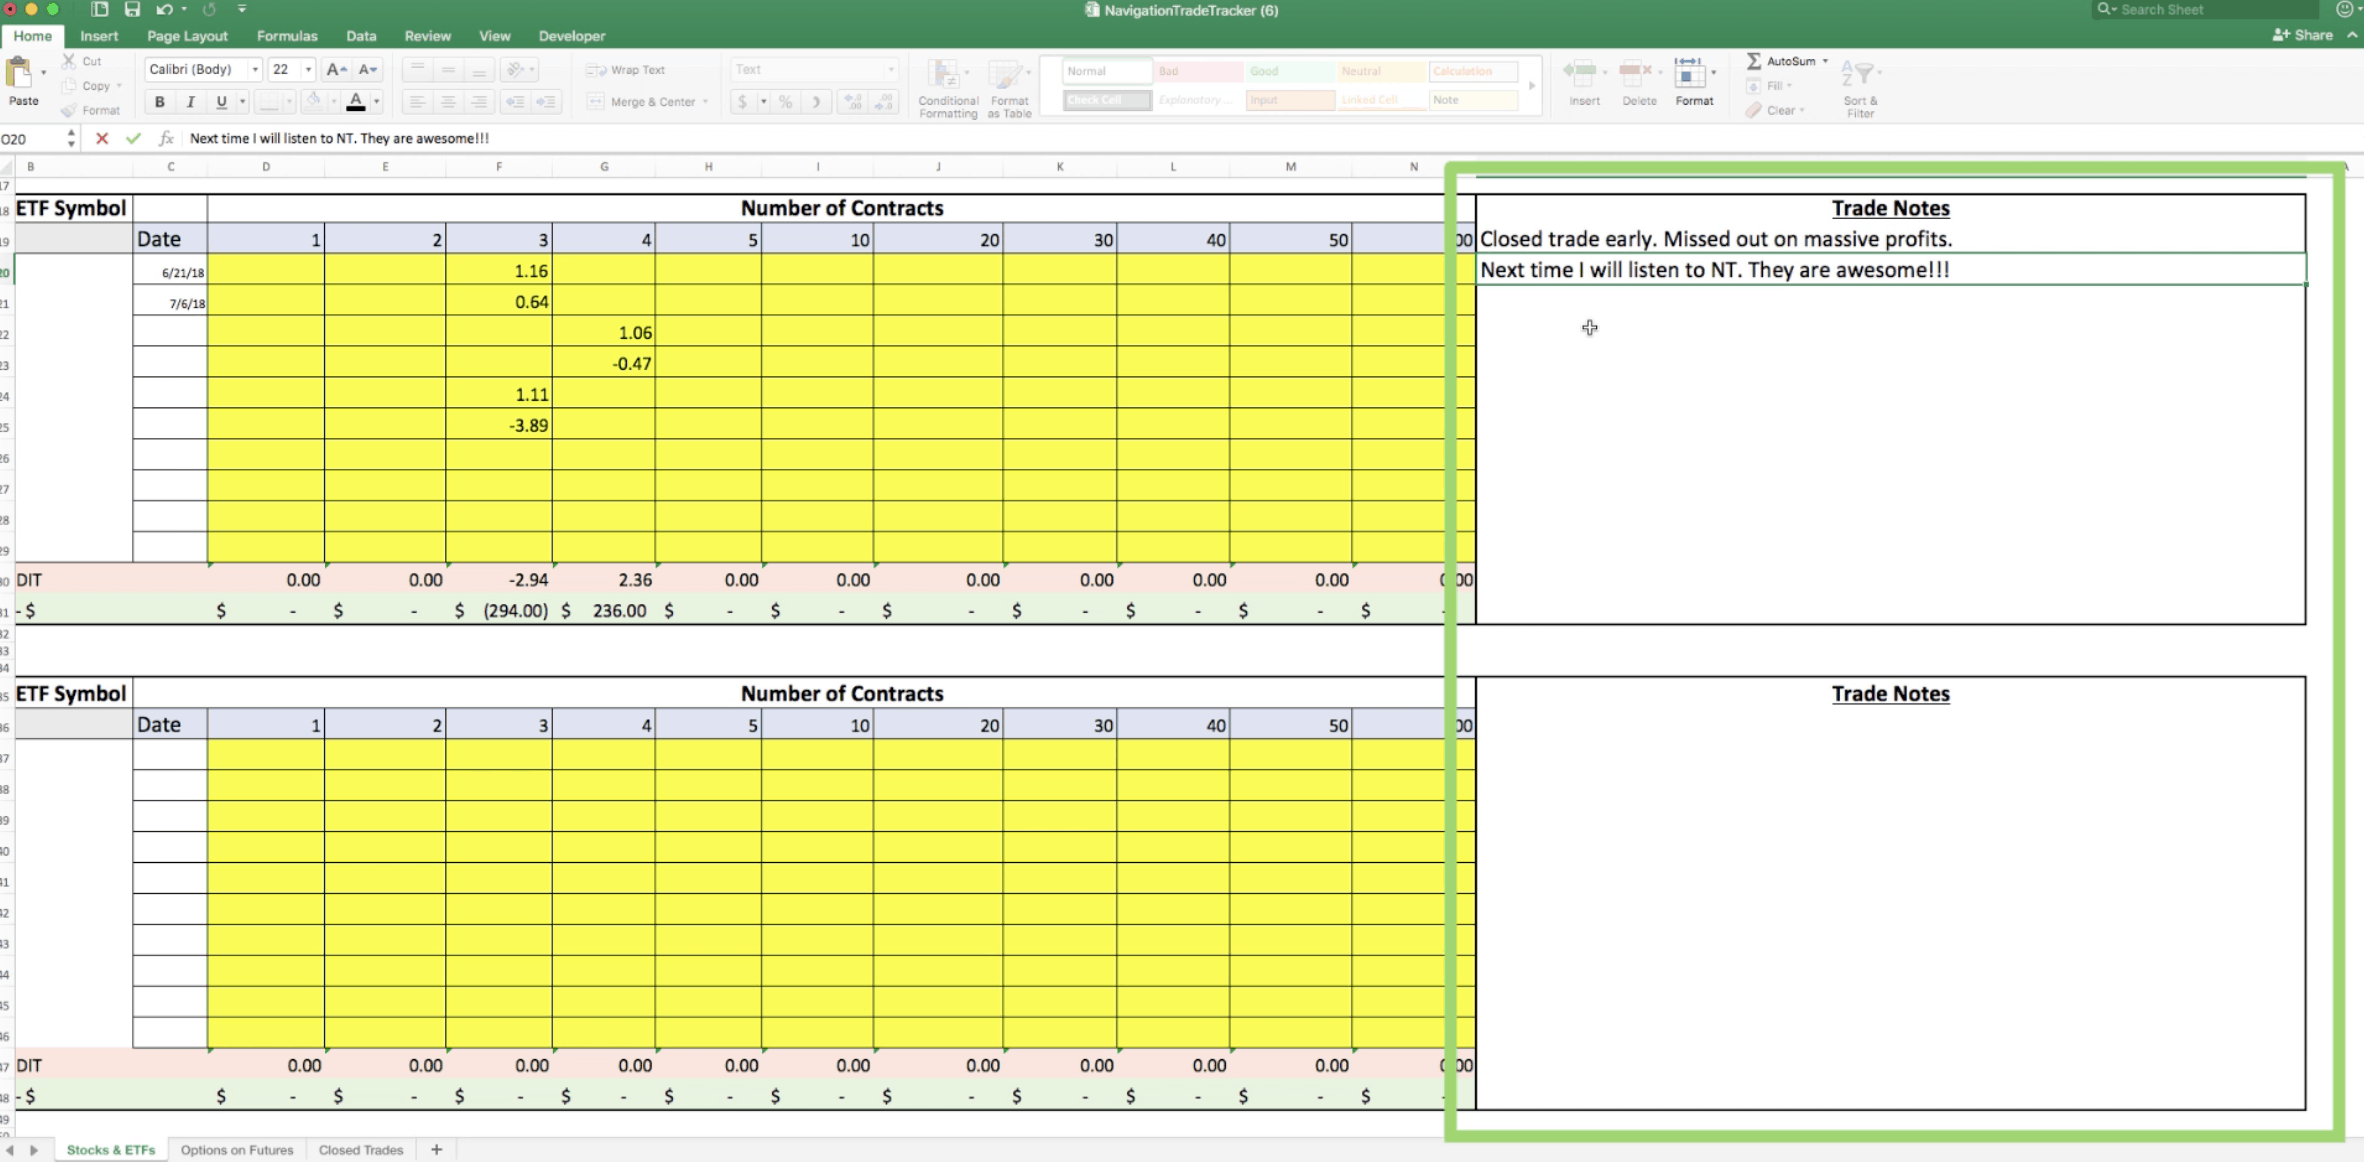
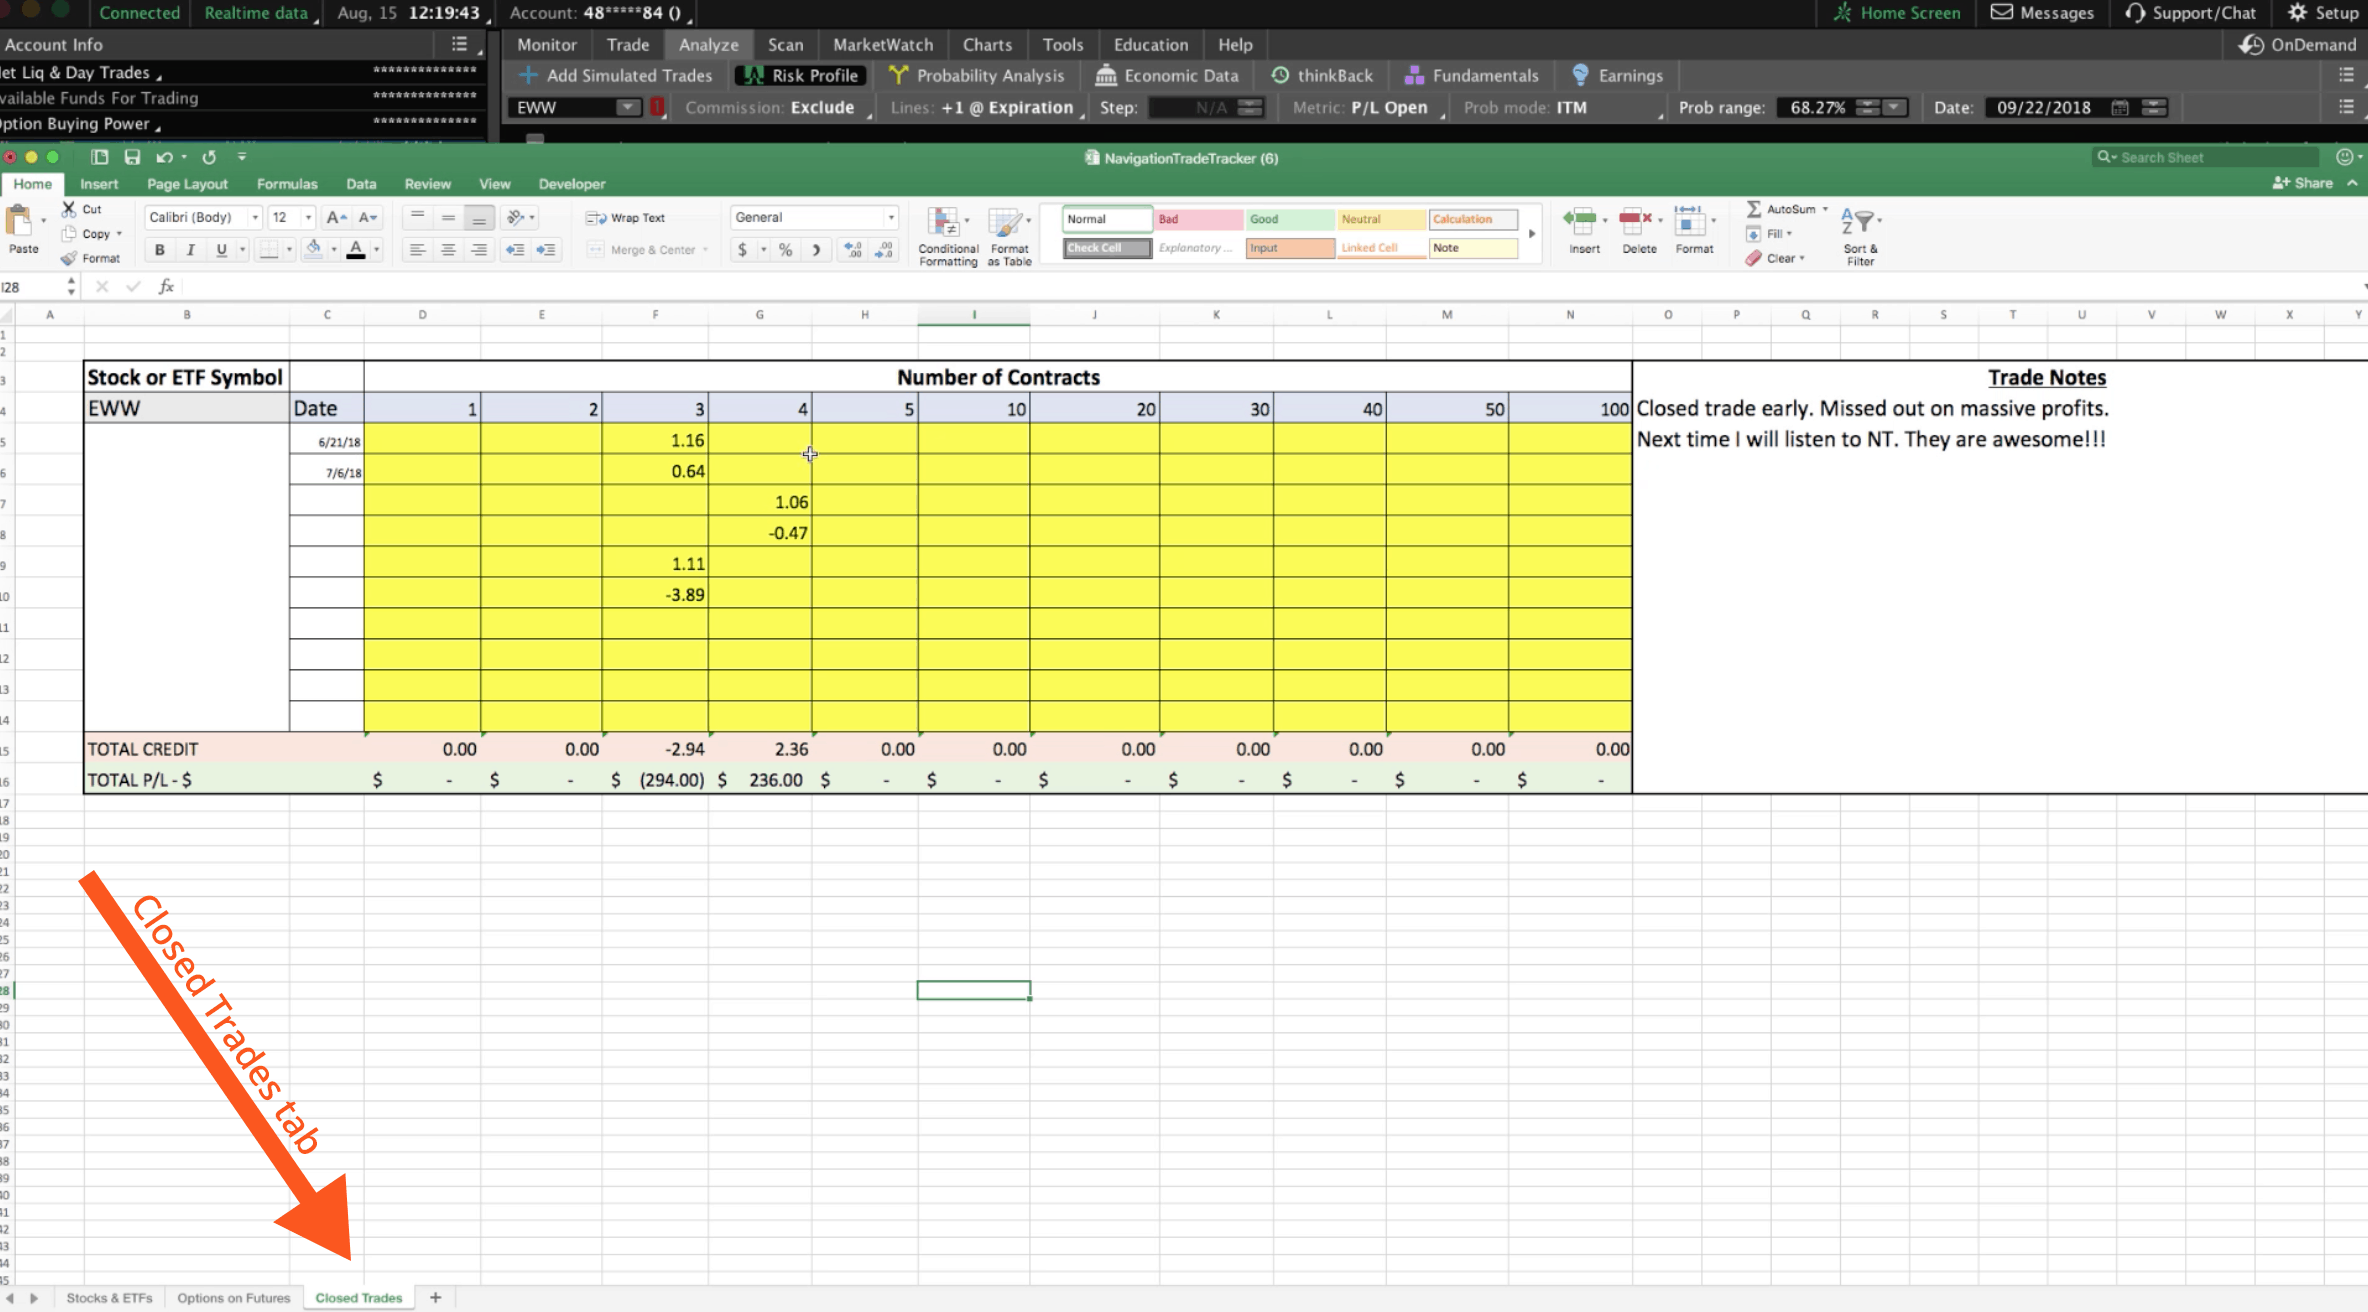
Then, after you’ve closed out a trade, if you want to keep track of it, you can just copy the entire thing. Go over to the “Closed Trades” tab, and just right click and paste it. If the columns are kind of crunched in, all you have to do is right click, you select “paste special” and click on “column width”, and then hit okay, and it’ll expand it out like it was on the other page. You can continue to paste these closed trades all throughout this tab. You can go back to reference them, and to check your notes.
This will help you become a better trader!
Options on Futures Example
I want to go over one more example that’s very important, and it’s in reference to the “Options on Futures” tab. You’ve got the same notes up at the top, but you’ve also got these different tick sizes and tick values. Remember, every futures contract, when we’re trading options on futures, is priced a little bit differently, so they’re not all the same like they are for stocks and ETFs. Because of this, we created a chart for each symbol.
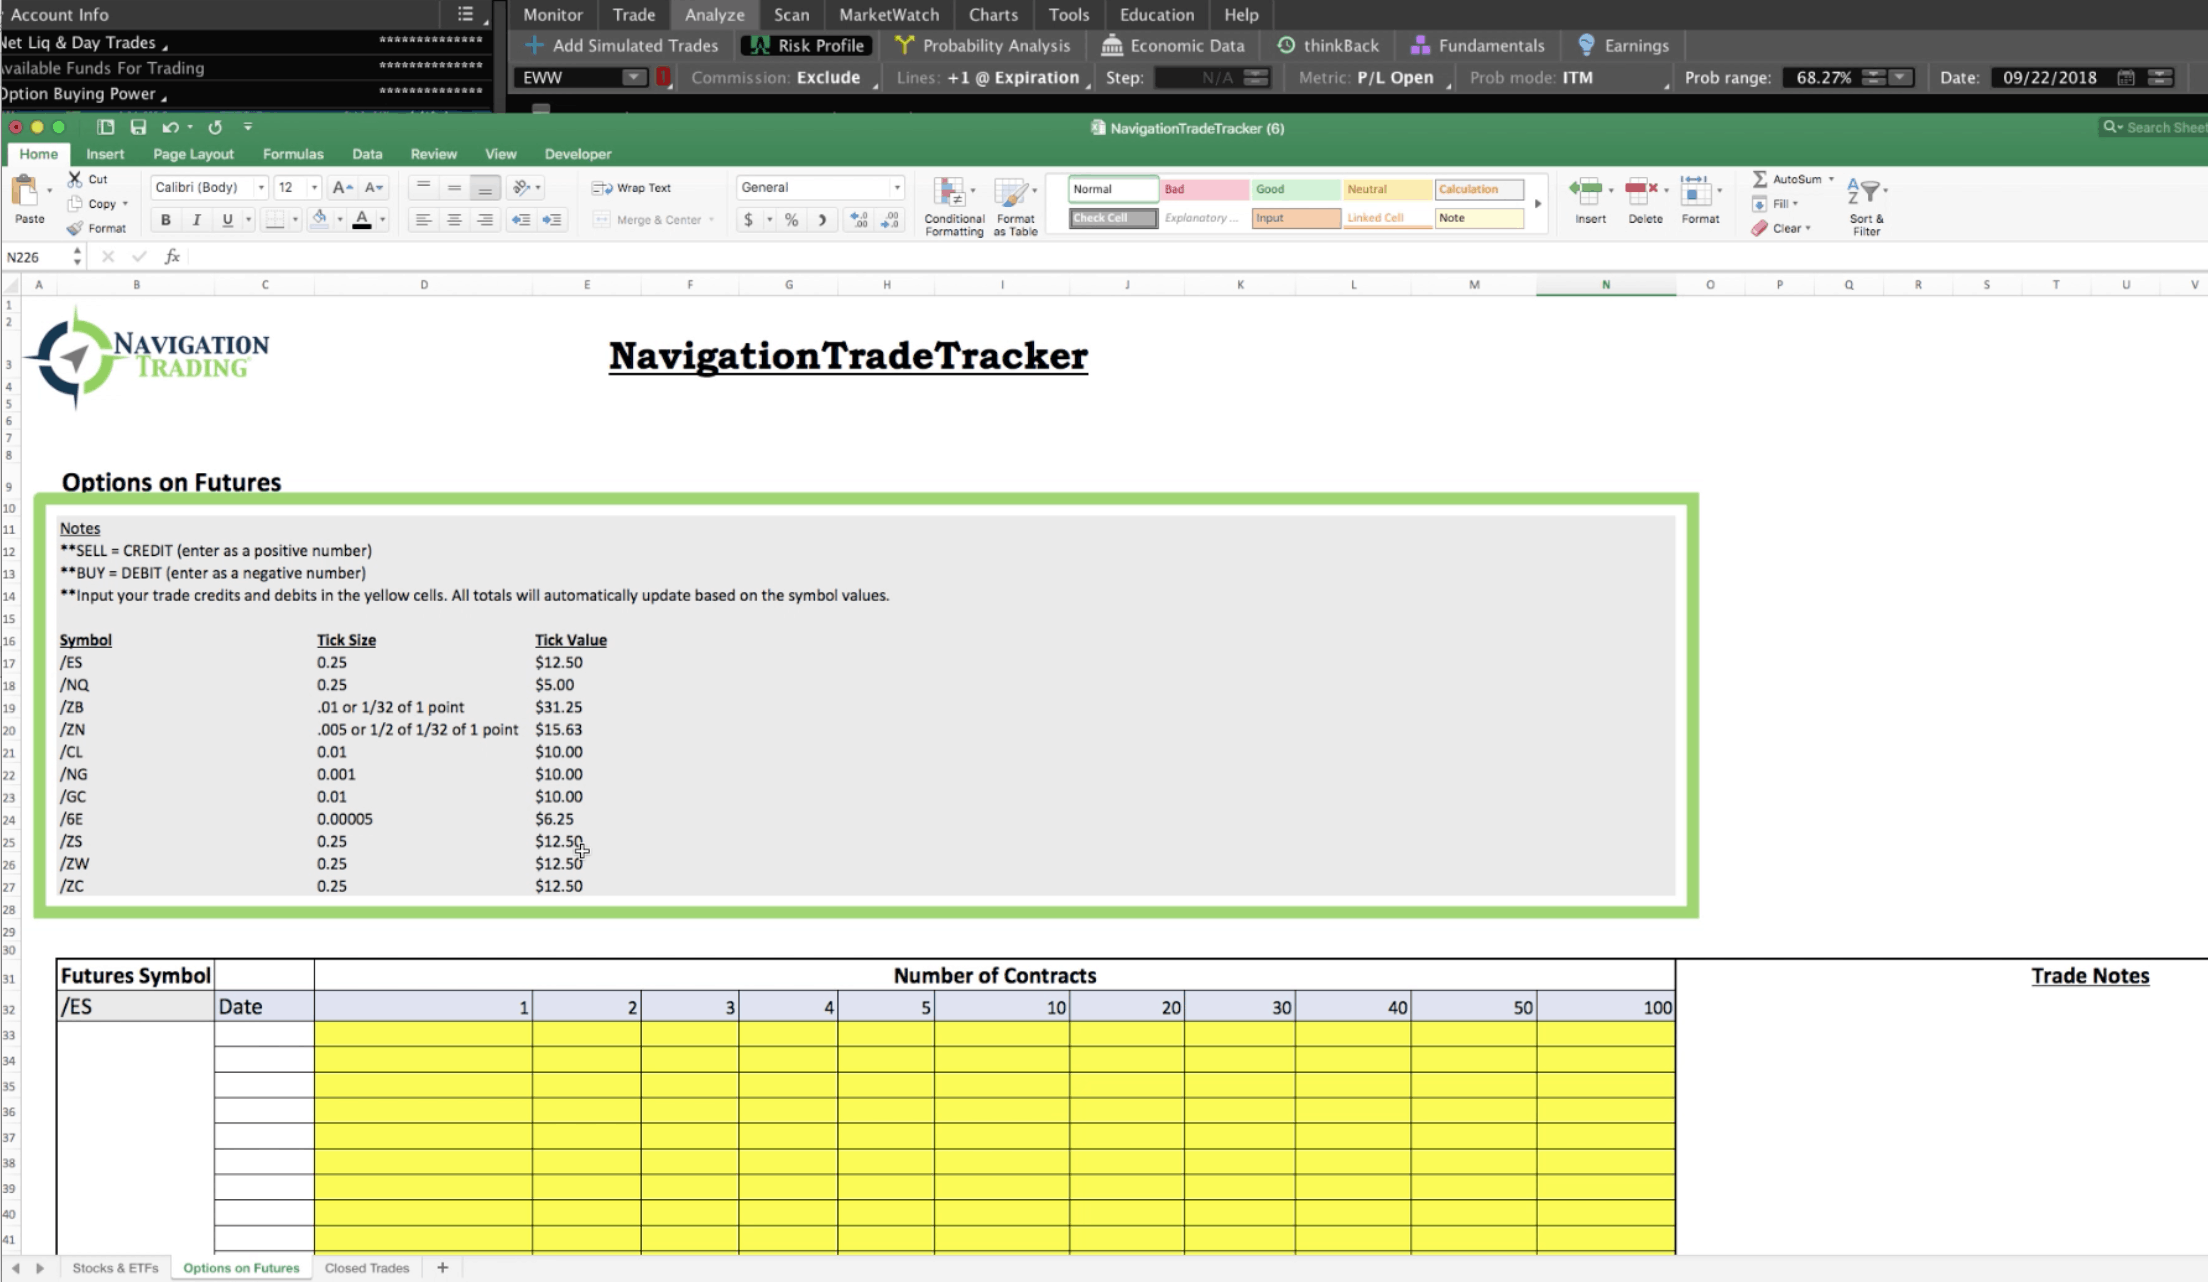
When we’re trading Options on Futures, each chart is specific to its symbol. We’ve got all the futures that we trade: /ES, /NQ, /ZB (bonds), /ZN (notes), /CL (oil), /NG (natural gas), /GC (gold), /6E (euro), /ZS (soybeans), /ZW (wheat), and /ZC (corn).
These are all priced so the formulas and the calculations to total these up for you are already built into the spreadsheet. So, you want to use these charts specifically for the symbol that is stated.
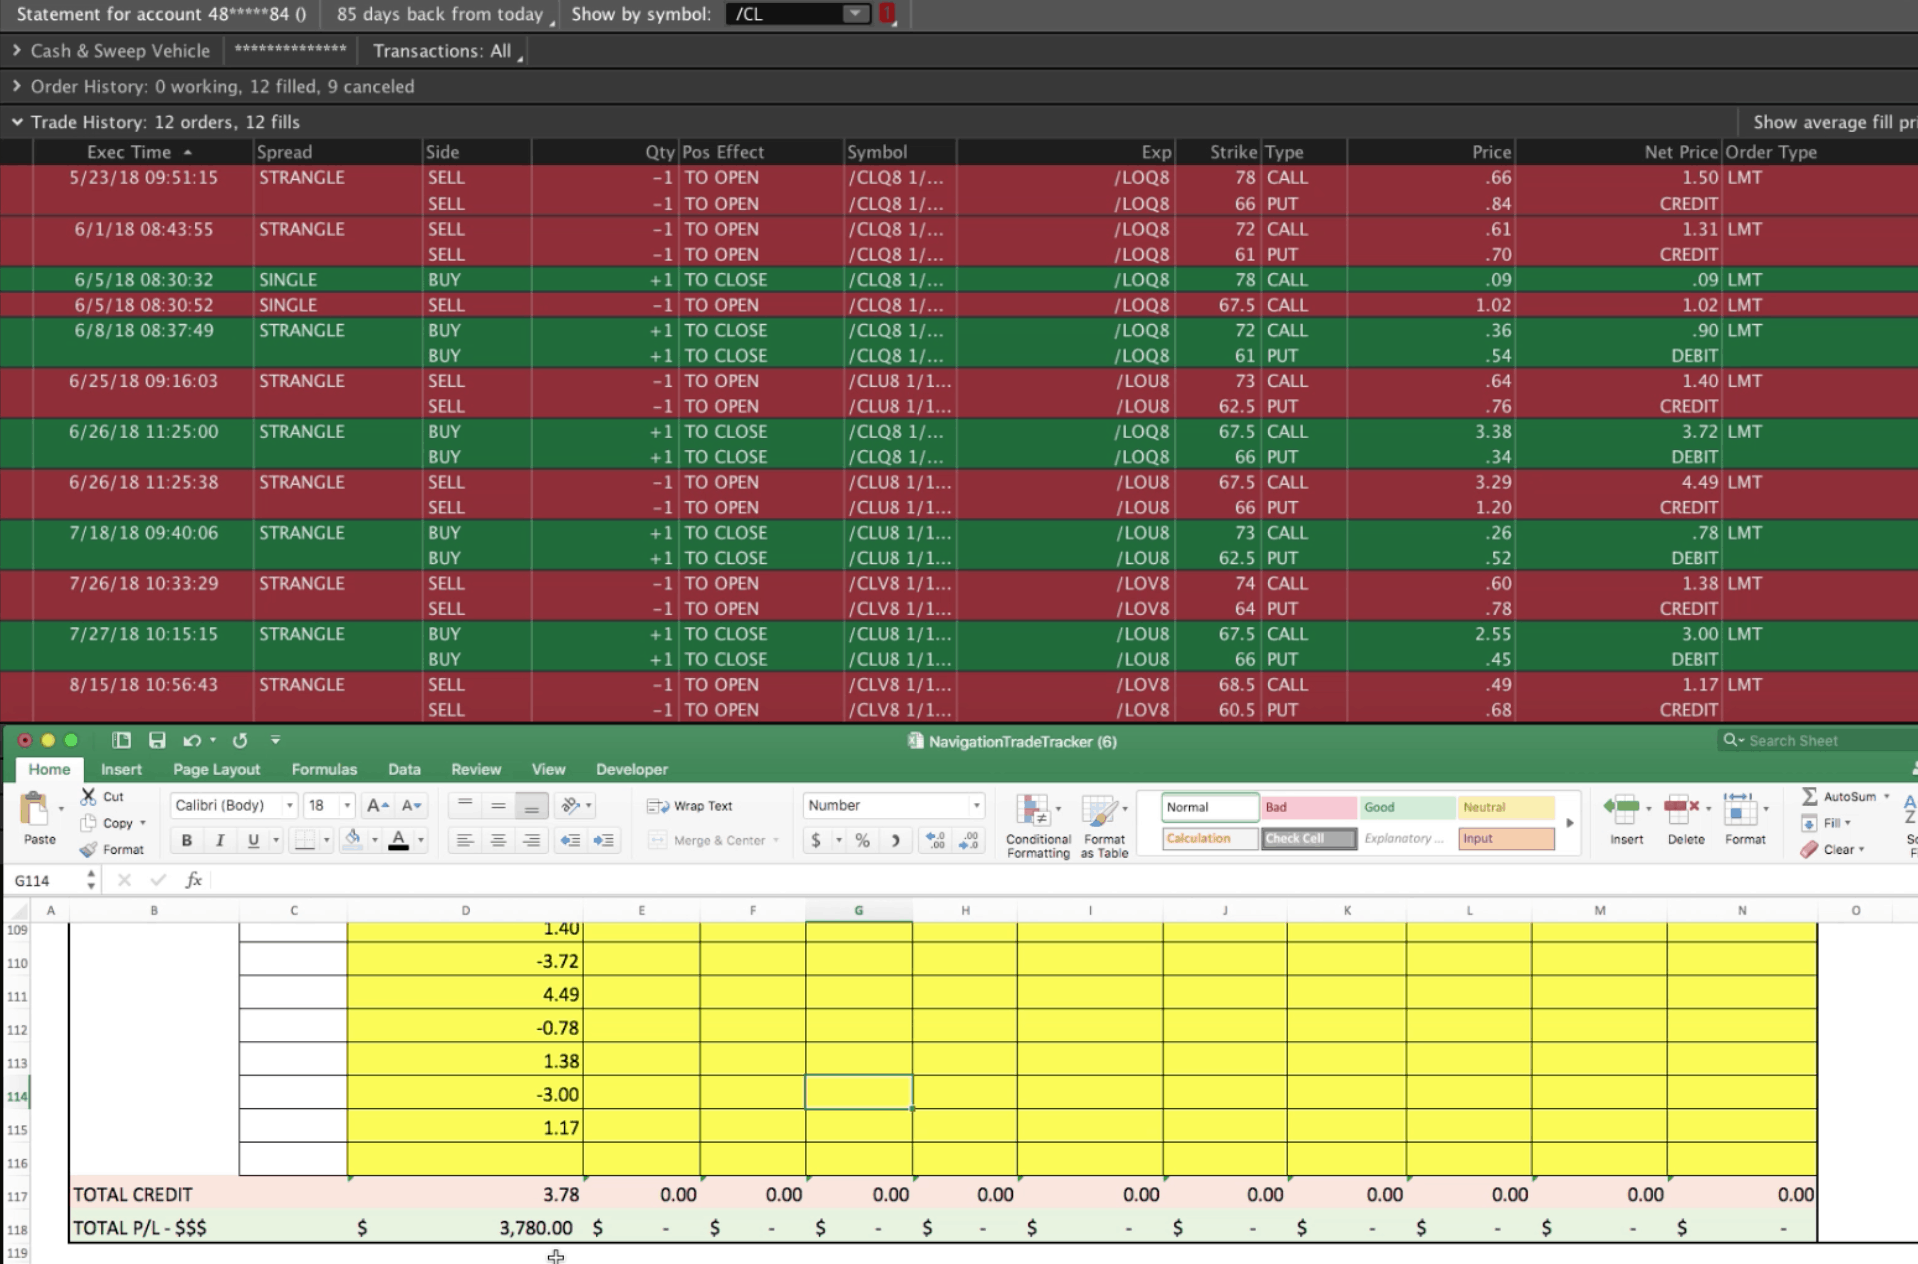
Let’s go to oil because this is one that we currently have open, and we’ve made several adjustments to.
We opened with a strangle of $1.50. Let’s enter 1.5 into the chart.
Then, we sold another strangle for $1.31, we’ll enter 1.31.
You can see we bought it back for 9 cents, that’s a debit, so we’ll enter -0.09.
Then, we had a roll credit of $1.02, so enter a positive 1.02.
Then, we had a debit of 90 cents, so that would be -0.9.
We had another credit of 1.4, so enter a positive 1.4.
There was another debit of 3.72, so we’d enter -3.72.
We had a credit of $4.49, so enter 4.49.
Then, we had a debit of 78 cents, so enter -0.78.
If you run out of rows, all you have to do is right click the row number of your last yellow row, highlighting the entire row, and then click “insert”. The calculations down at the bottom are still good because these are using formulas to make the calculations.
Moving forward, we had a credit of $1.38, so that’s a positive 1.38.
Then, we had a debit of $3, so that’s -3.
Lastly, we had a credit of $1.17, so 1.17.
Now, we’ve got a total credit of 3.78 That’s $3,780 translated into dollar amount.
We’re actually still in this trade. If we go to the “Analyze” tab, we can see exactly where we’re at. We can look at one of our strangles here, which we just put on, so that’s going to be pretty much at breakeven. I’m not going to enter that one at this point.
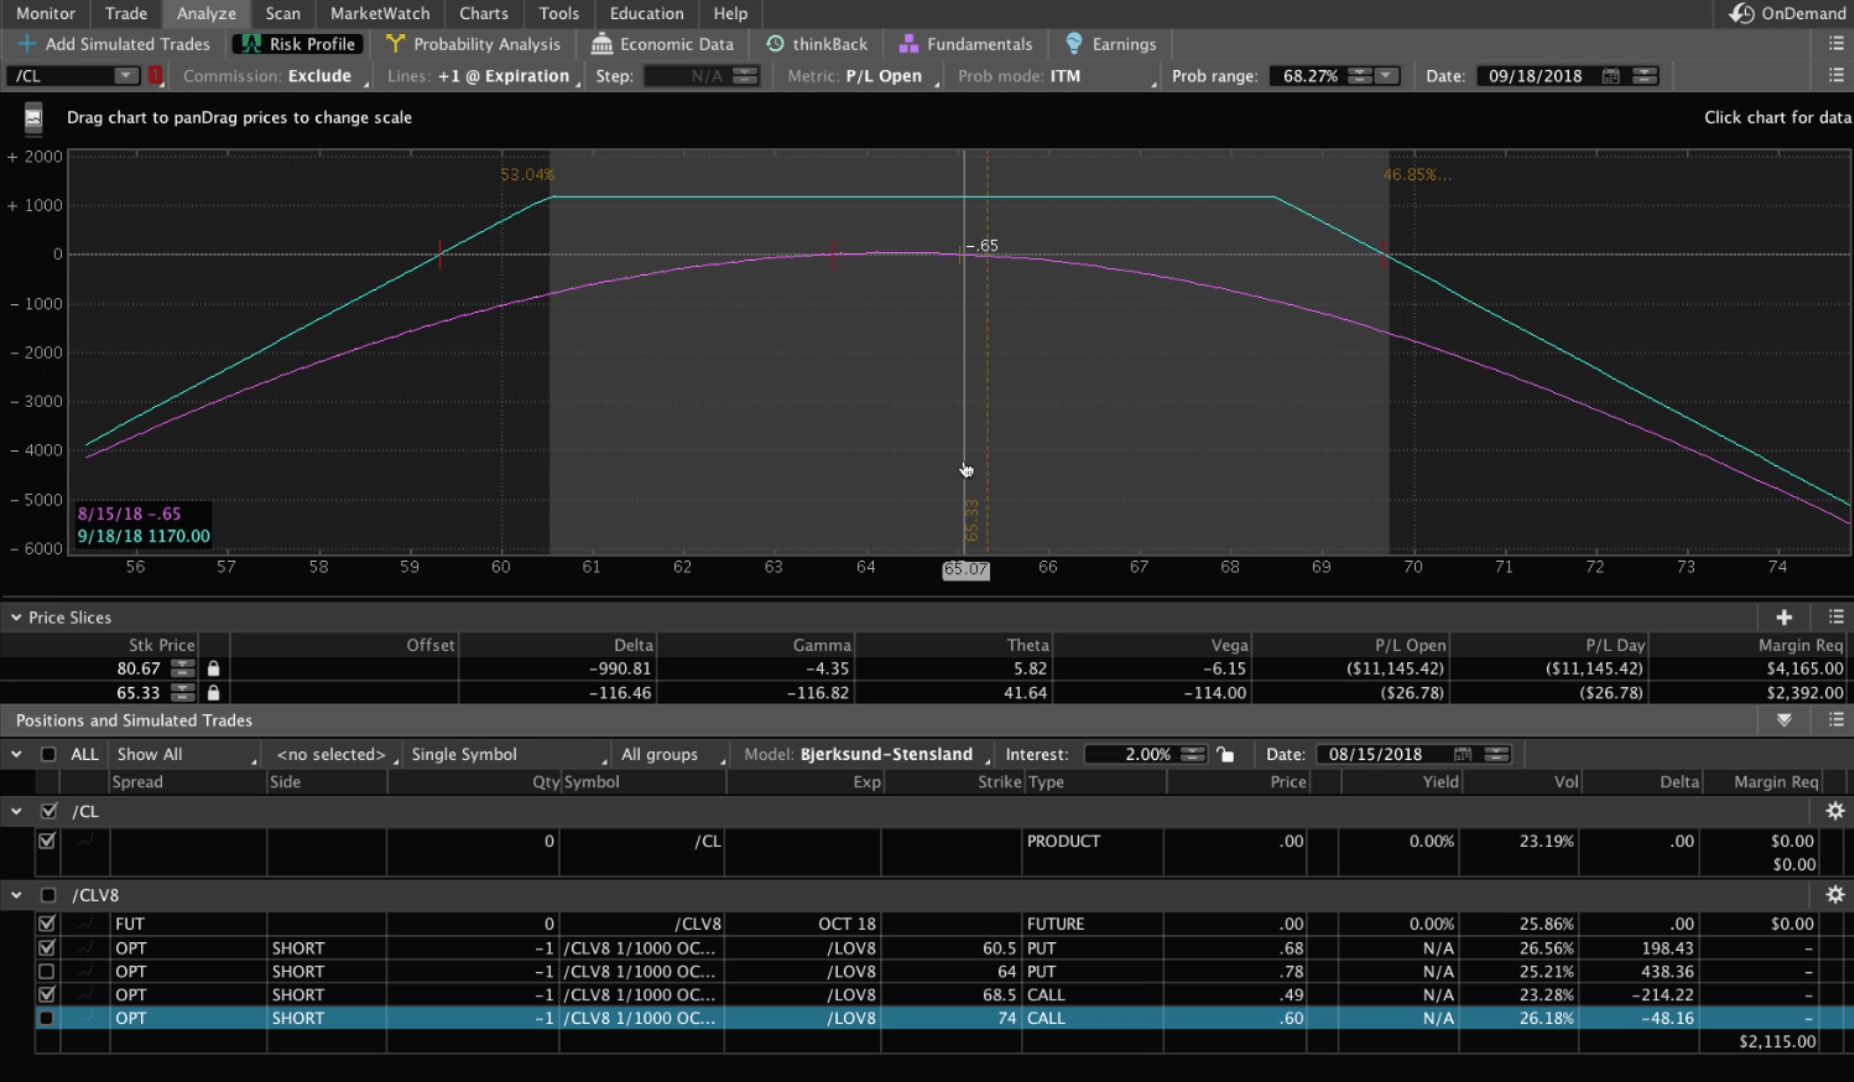
But we do have another strangle on here, and so if I look to close that out, by right clicking, selecting “Create closing order”, I can see we’d buy that back for about $1.79.
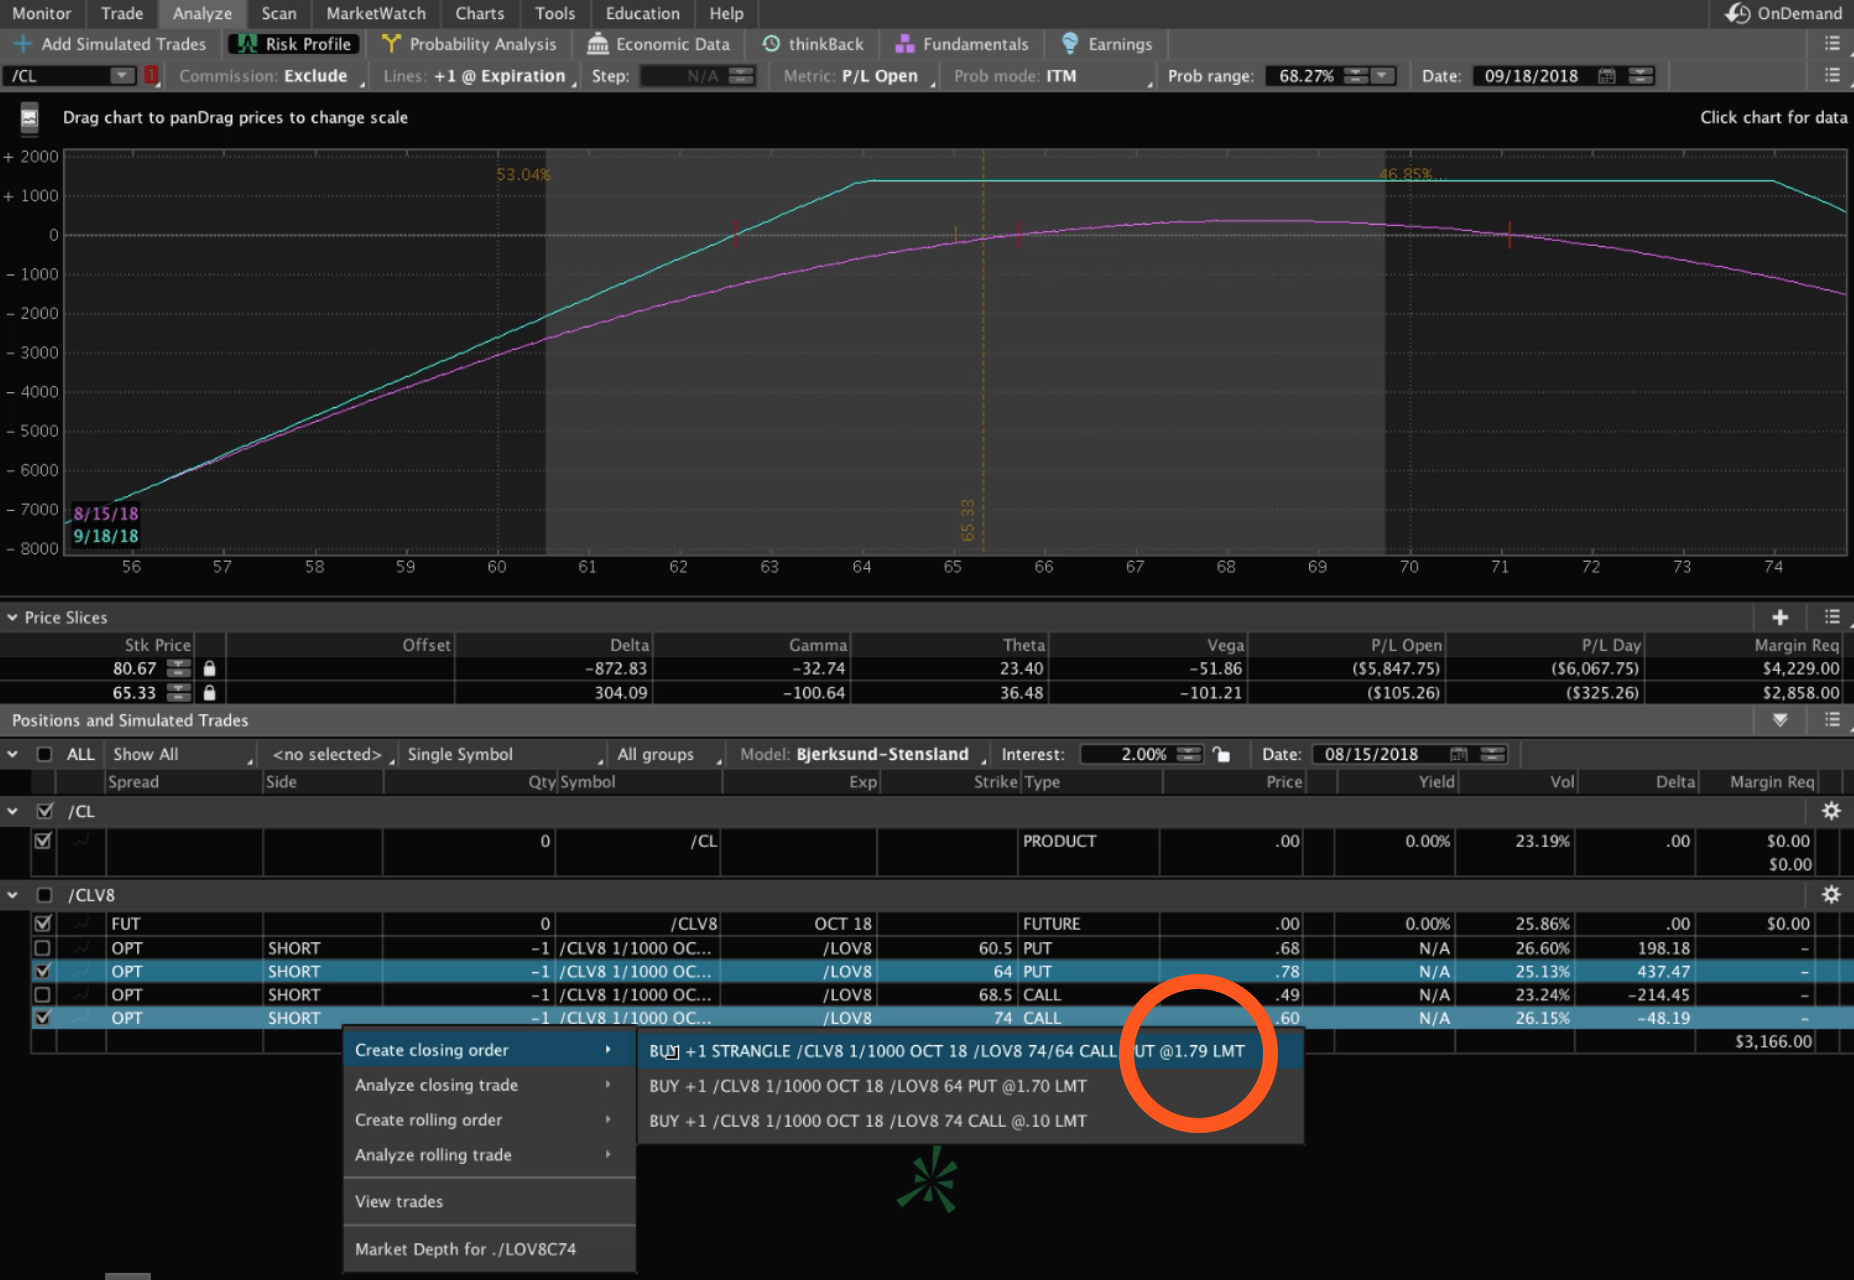
So, we can enter -1.79 in the spreadsheet just to give us an accurate reading.
If we closed out of our trades right now, we’d have a total credit of 1.99, which translates into almost $2,000 in profit on our oil trade.
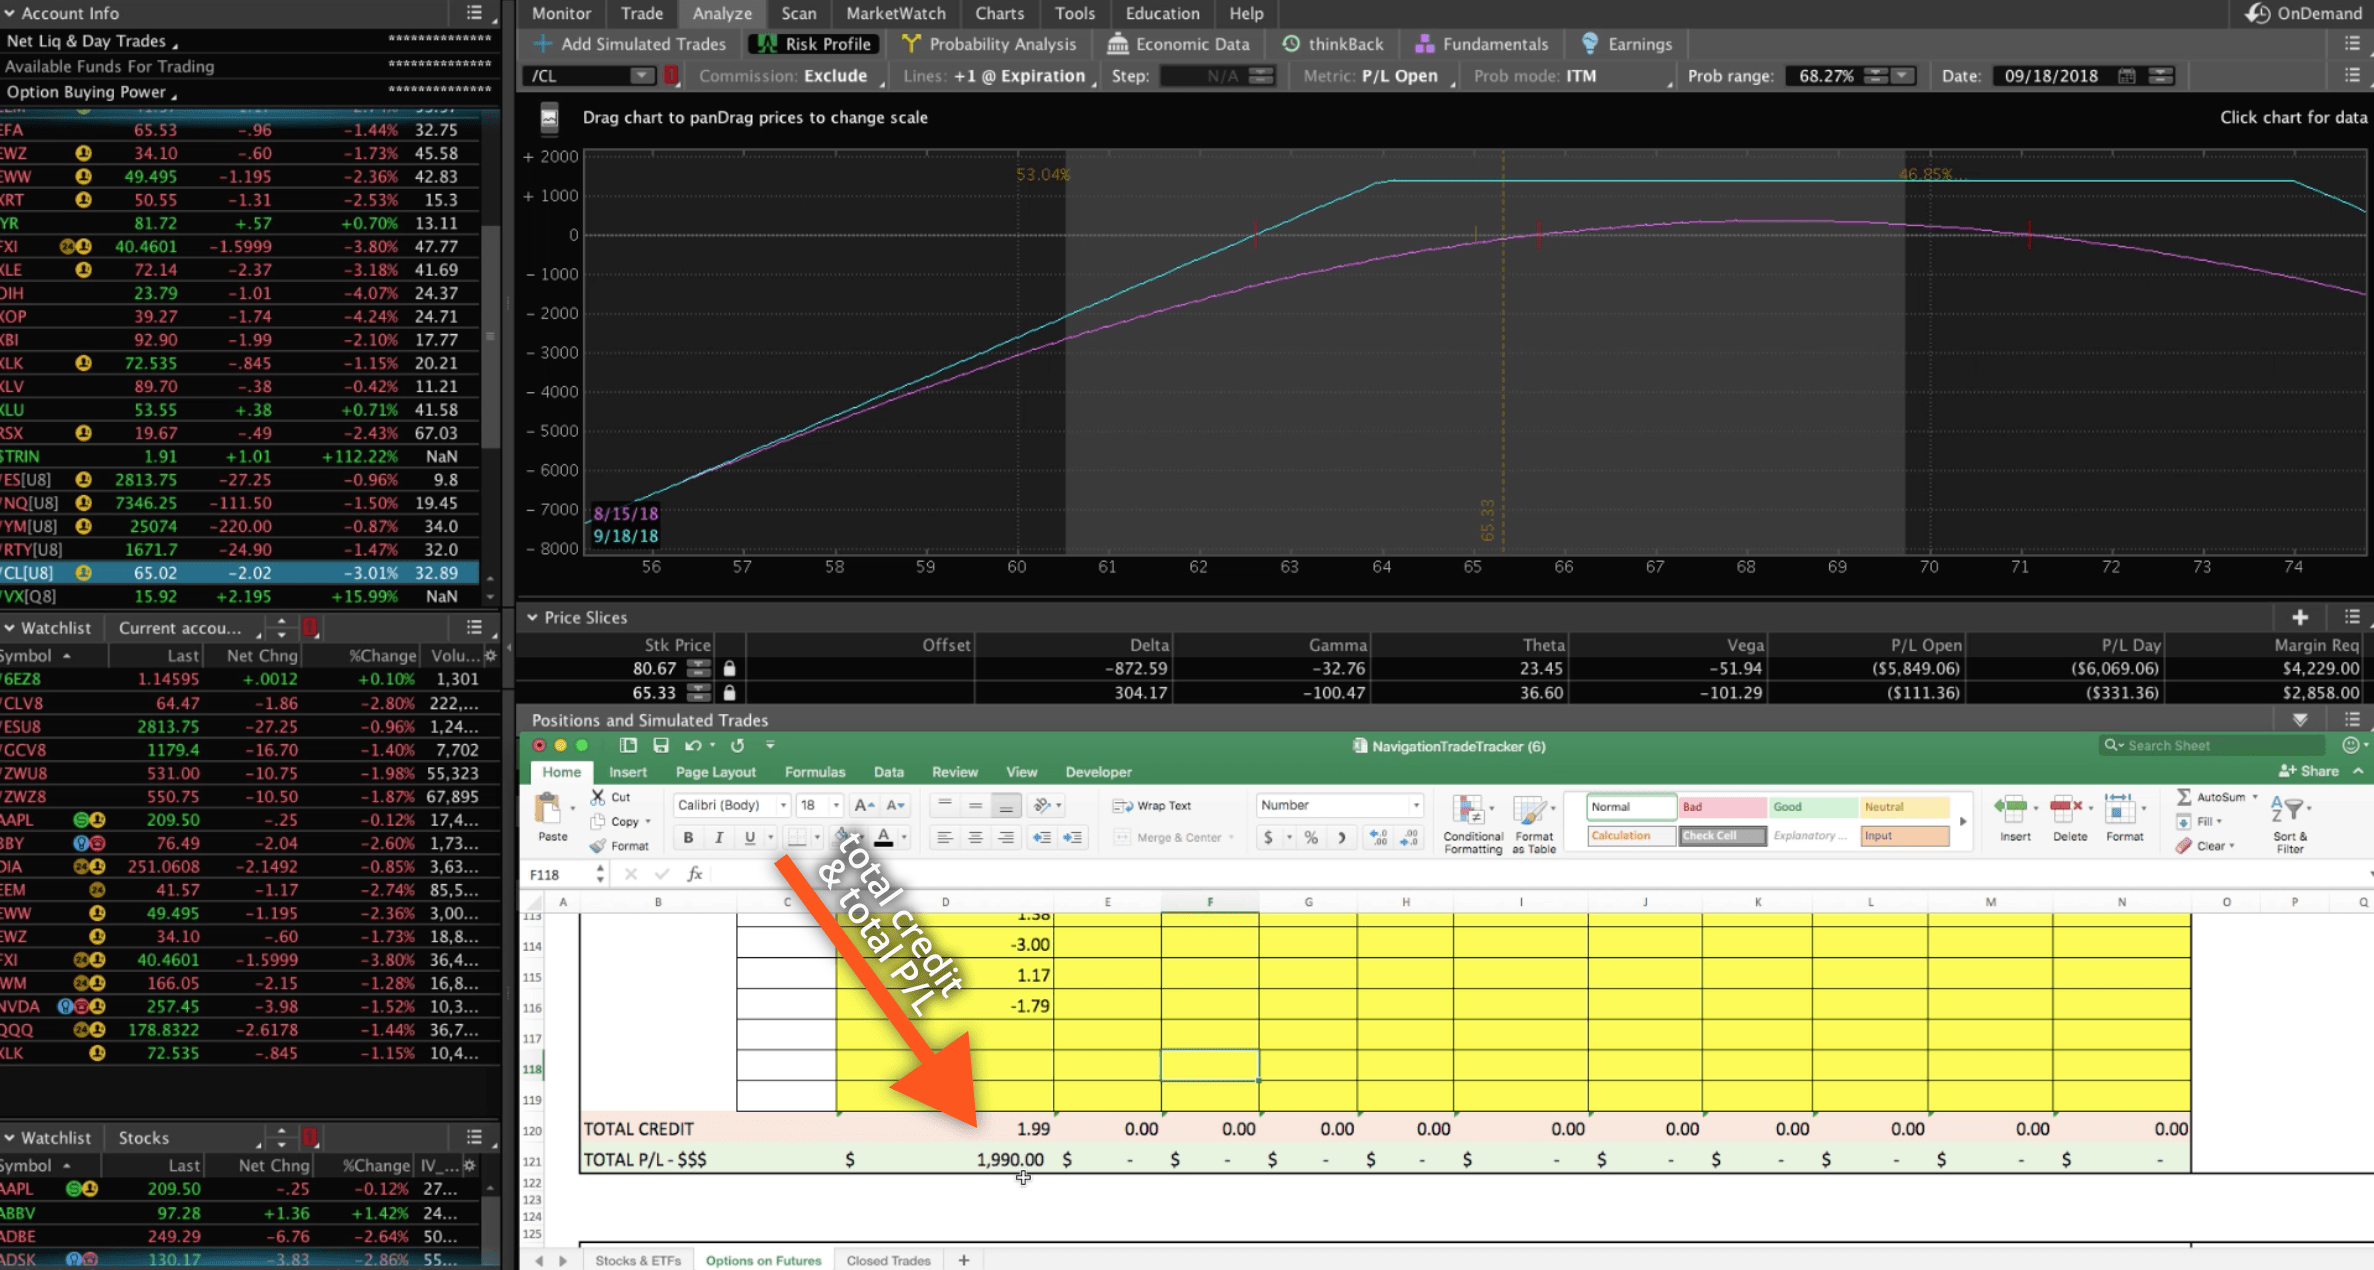
That’s the power of this tool, it makes it easy for to enter your debits and credits. The spreadsheet adds it all up for you. If you have different pieces with a different number of contracts, you can do that, and it’ll all add up for you.
I hope this tutorial on our new tool was helpful! Having some type of trade tracking tool has been a request that we’ve had from a lot of members for a while now. Hopefully, we’ve taken a lot of the leg work out for you, specifically with the formulas that we’ve already created for all the different futures symbols because they have different tick sizes and tick values.
Then, of course, on the stocks and ETFs, this tool just makes it easy for you. Even though they’re all the same tick size and tick value, trading multiple contracts and different pieces of the trade can be hard to keep track of, and we hope this tool helps. Journaling your trades, documenting your trades, and being able to go back and look at all of your trades is such a powerful thing and will help you become a more successful trader.
If you have any questions, let us know, and as always…We appreciate your feedback!
Happy Trading!
-The NavigationTrading Team



Follow