
Welcome back to another lesson from NavigationTrading!
In this lesson, we’ll be going over Butterfly Spreads.
Why do we trade Butterflies?
-
- Defined Risk – We are able to define exactly the amount of money that we want to risk on the trade, before we even enter.
- IRA Eligible – You can trade a Butterfly in an IRA account, or in a margin account.
- Delta Neutral – We do not have to make a directional assumption on the underlying stock, or ETF, before we put the trade on. We like to enter them as delta neutral trades.
- Positive Theta – This means, as the options decay, as they get closer to expiration, we collect that positive theta, which is putting money into our account.
Choose Your Trading Vehicle
The first thing that we’re going to do is choose a liquid underlying. Only use trading vehicles on the NavigationTrading Watch List. If you don’t have a copy of our watch list, go to navigationtrading.com/free-member, enter your email address and we’ll send you that watch list for free.
You want to make sure that you’re in a vehicle that has a lot of volume. This allows you to get in and out of the trade very easily.
Also, be sure the options have tight bid/ask spreads, so it’s not eating up your profits.
Our preference at NavigationTrading is to look for opportunities to trade an index, or an ETF first, and then I look at stocks second.
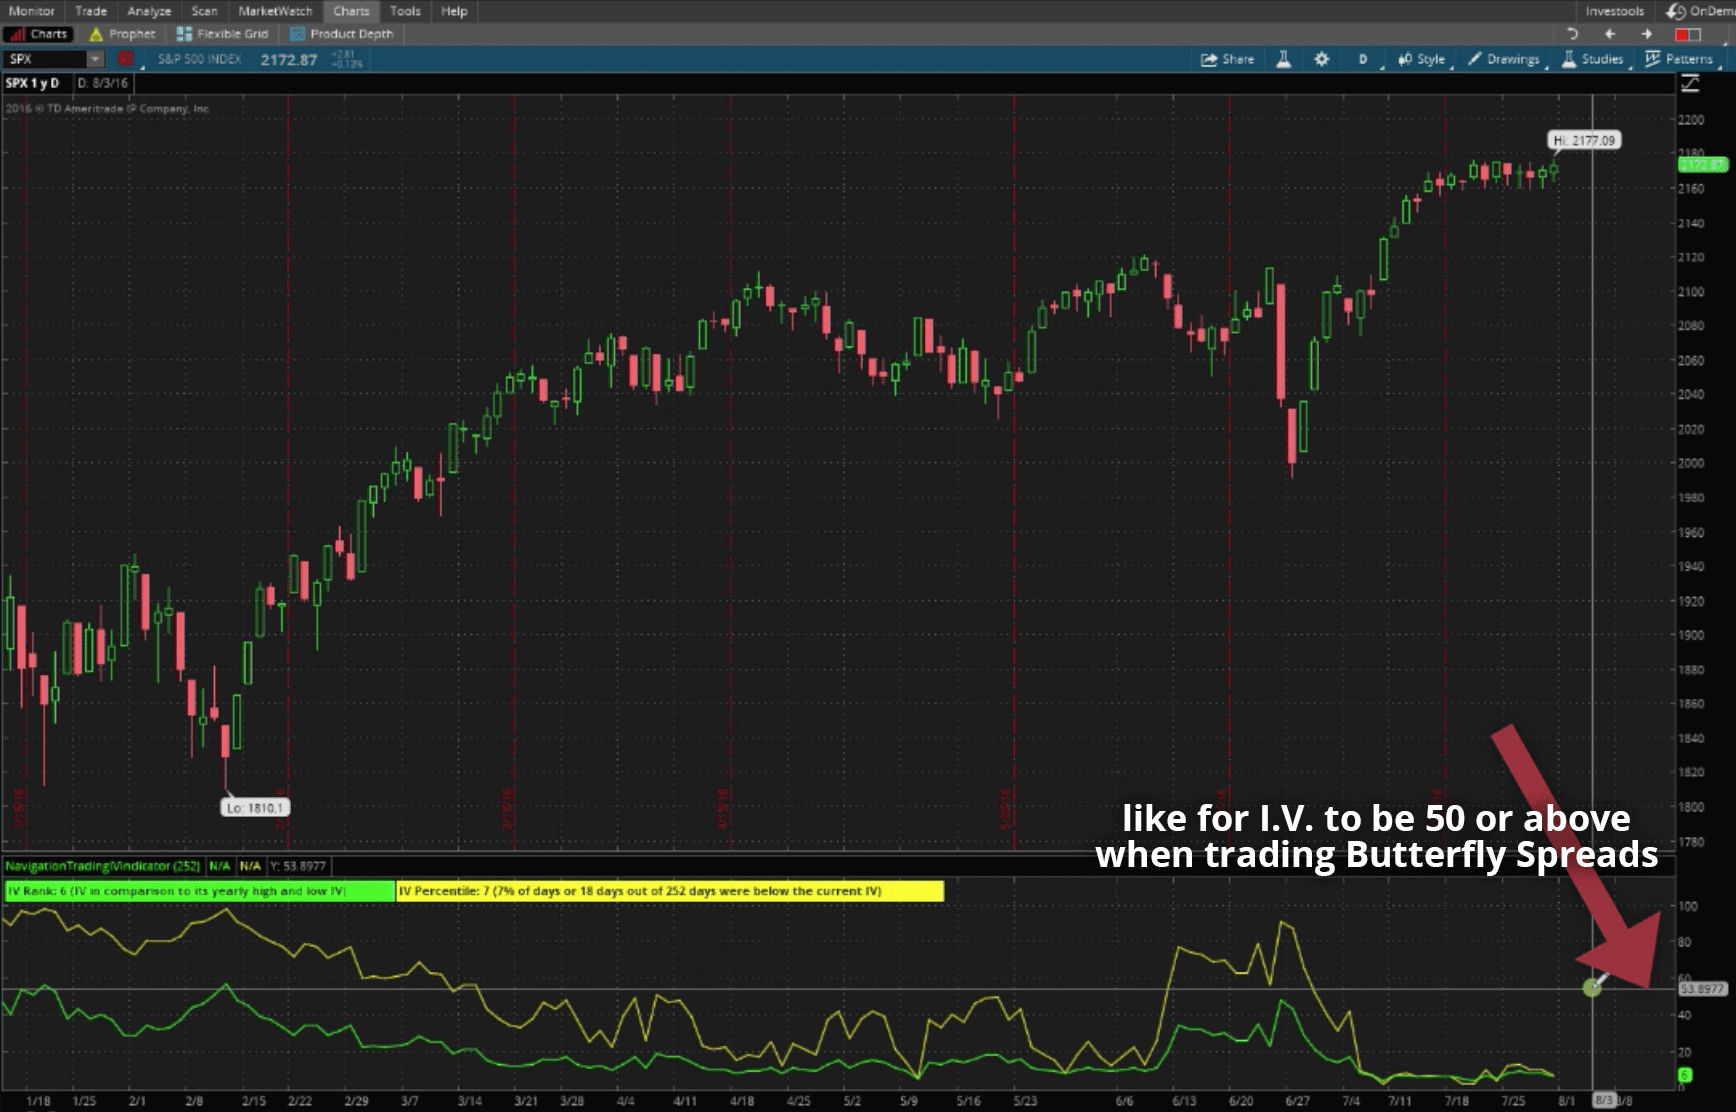
Choose a Vehicle with High Implied Volatility
You want to choose a vehicle with high implied volatility, if possible. When we go to the platform, you’ll see that we are in a very low implied volatility environment right now, so there’s not a lot to choose from, as far as high implied volatility options. However, if at all possible, you want to start with high implied volatility.
The way that we measure implied volatility, is by looking at the implied volatility rank, and the implied volatility percentile. We want to make these trades, if at all possible, when the I.V. rank or I.V. percentile is over 50.
Setting Up the Trade
When you begin to set up your trade, you’ll need to choose your timeframe.
How many days to expiration do you want your options to be, to enter the Butterfly trade?
Forty-five days to expiration is optimal. Anywhere between 30-60 days left to expiration is a great time to be entering these trades.
Choose Your Strikes
A Butterfly is made up of two Short Calls at-the-money. Long calls should be at or near the expected move. I’ll explain that more when we get to the Platform.
As a tip, you can set up a Butterfly Spread with all Puts or all Calls. We like to start with Calls. As long as you’re consistent when you set them up, that’s all that really matters.
Platform Example
Let’s go to the thinkorswim platform and take a look. The vehicle that we’ll look at today is SPX.
As you can see from the indicator below the chart, volatility is very low. We’re using the NavigationTrading Implied Volatility Indicator, which shows the I.V. rank in green, and the I.V. percentile in yellow. We really like to see at least one of those above 50, when we enter this type of trade. There’s really not a symbol out there, at the time of this tutorial, that has a high implied volatility.

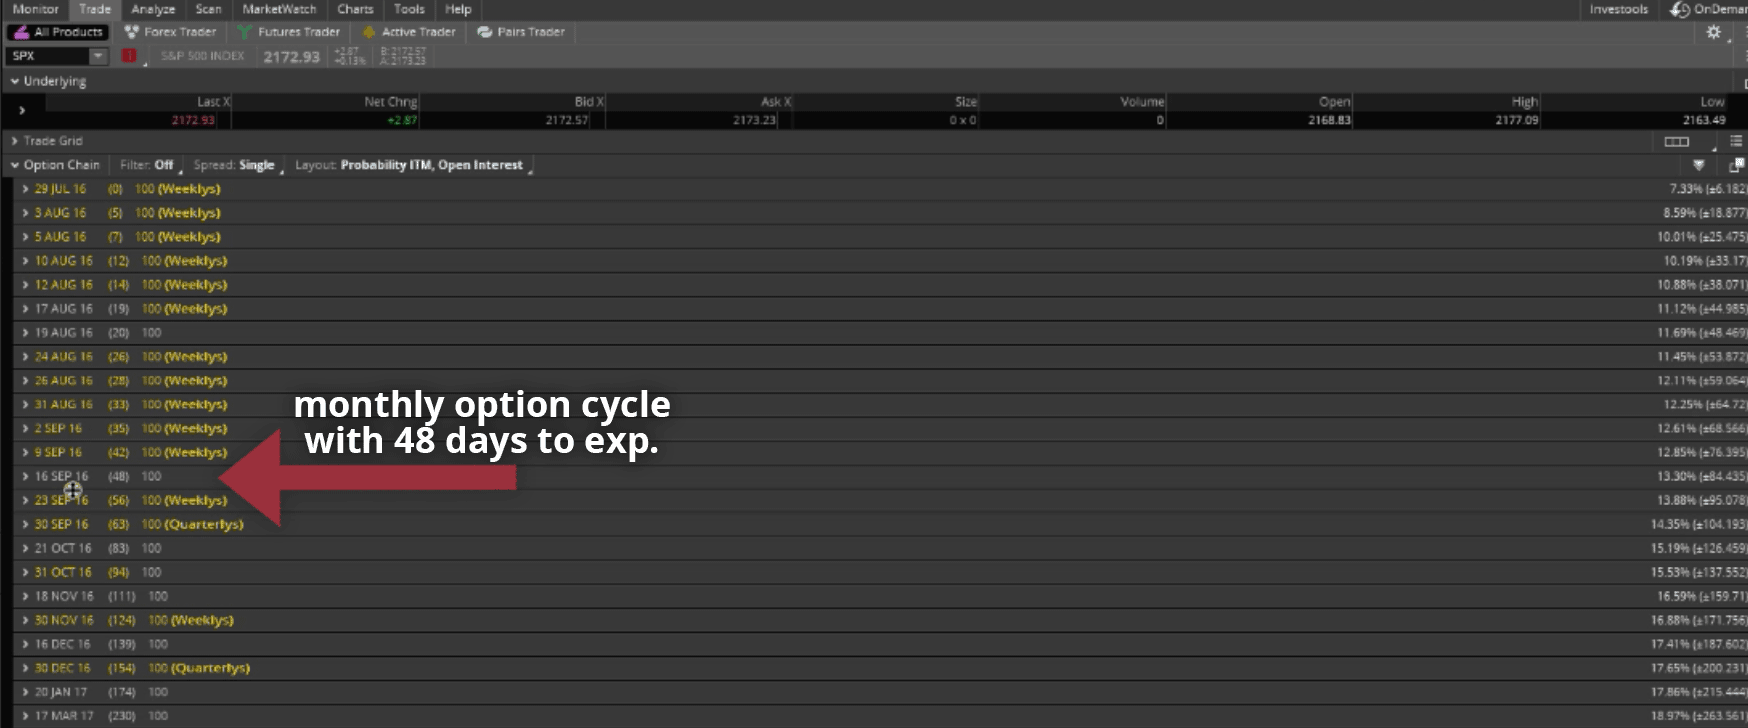
Let’s go to the Trade tab on thinkorswim. Remember, we want to be between 30-60 days left to expiration. We stay away from the weeklies, opting for the monthly option cycles. You’ll see in parenthesis, the option cycle we’ve indicated below is 48 days away from expiration. That’s pretty much perfect. It’s close to that 45-day mark that we like to see.

When you open your option chain, you’ll want to go to the Call side on the right, and go to the at-the-money Calls. The S&P 500 is trading at 2172. We can either choose the 2170 or 2175. It doesn’t really matter. I’m going to go with the 2170. Just right-click, select “BUY”, and then select “Butterfly”.
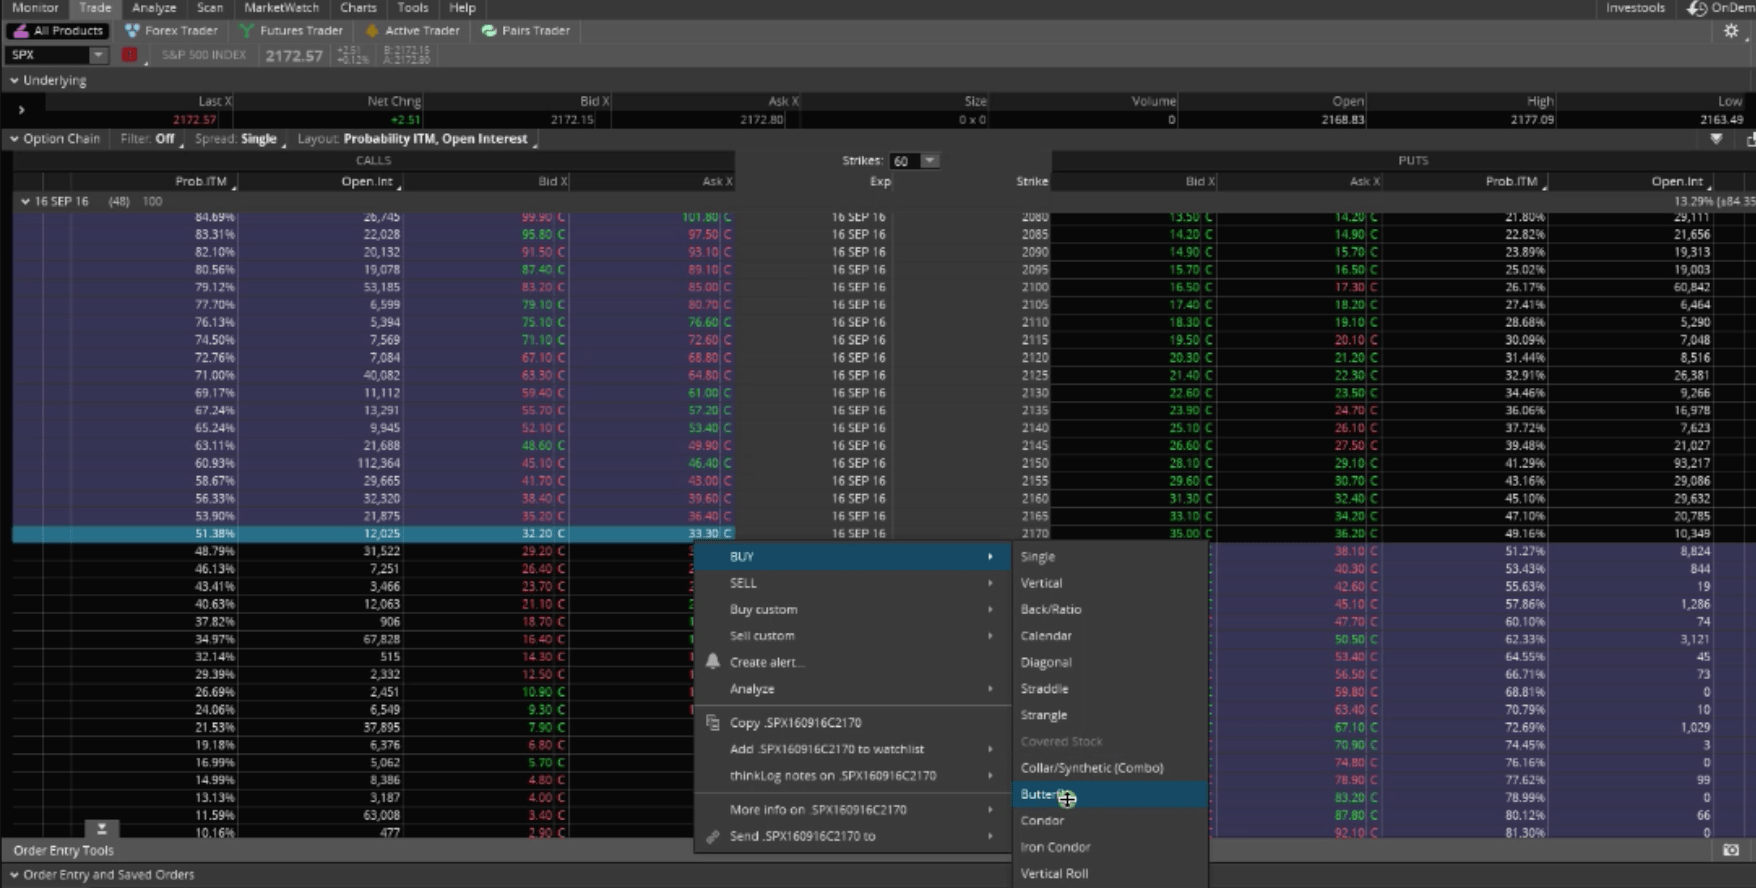

That will populate our order.
By default, the platform will populate to the closest strikes. That’s a very narrow Butterfly. We don’t want to use those strikes. We want to base our long strikes around the expected move for the 48-day timeframe. To do that, you’d look at the top right, in parenthesis, there’s the number 84.4. We would round that to 85.
You can see, in the Order Entry area, the Call on top is a lower strike. We want to go about 85 points lower, than where our short strikes are, which are dictated by the negative numbers. There is always going to be two Short Calls, and then a Long Call on each side of it. The top one will be the lower strike. Let’s count 85 down from 2170. That’d be the 2085.
Then, we want to go 85 points above or higher than 2170. That’d be the 2255. We’d update that strike as well.
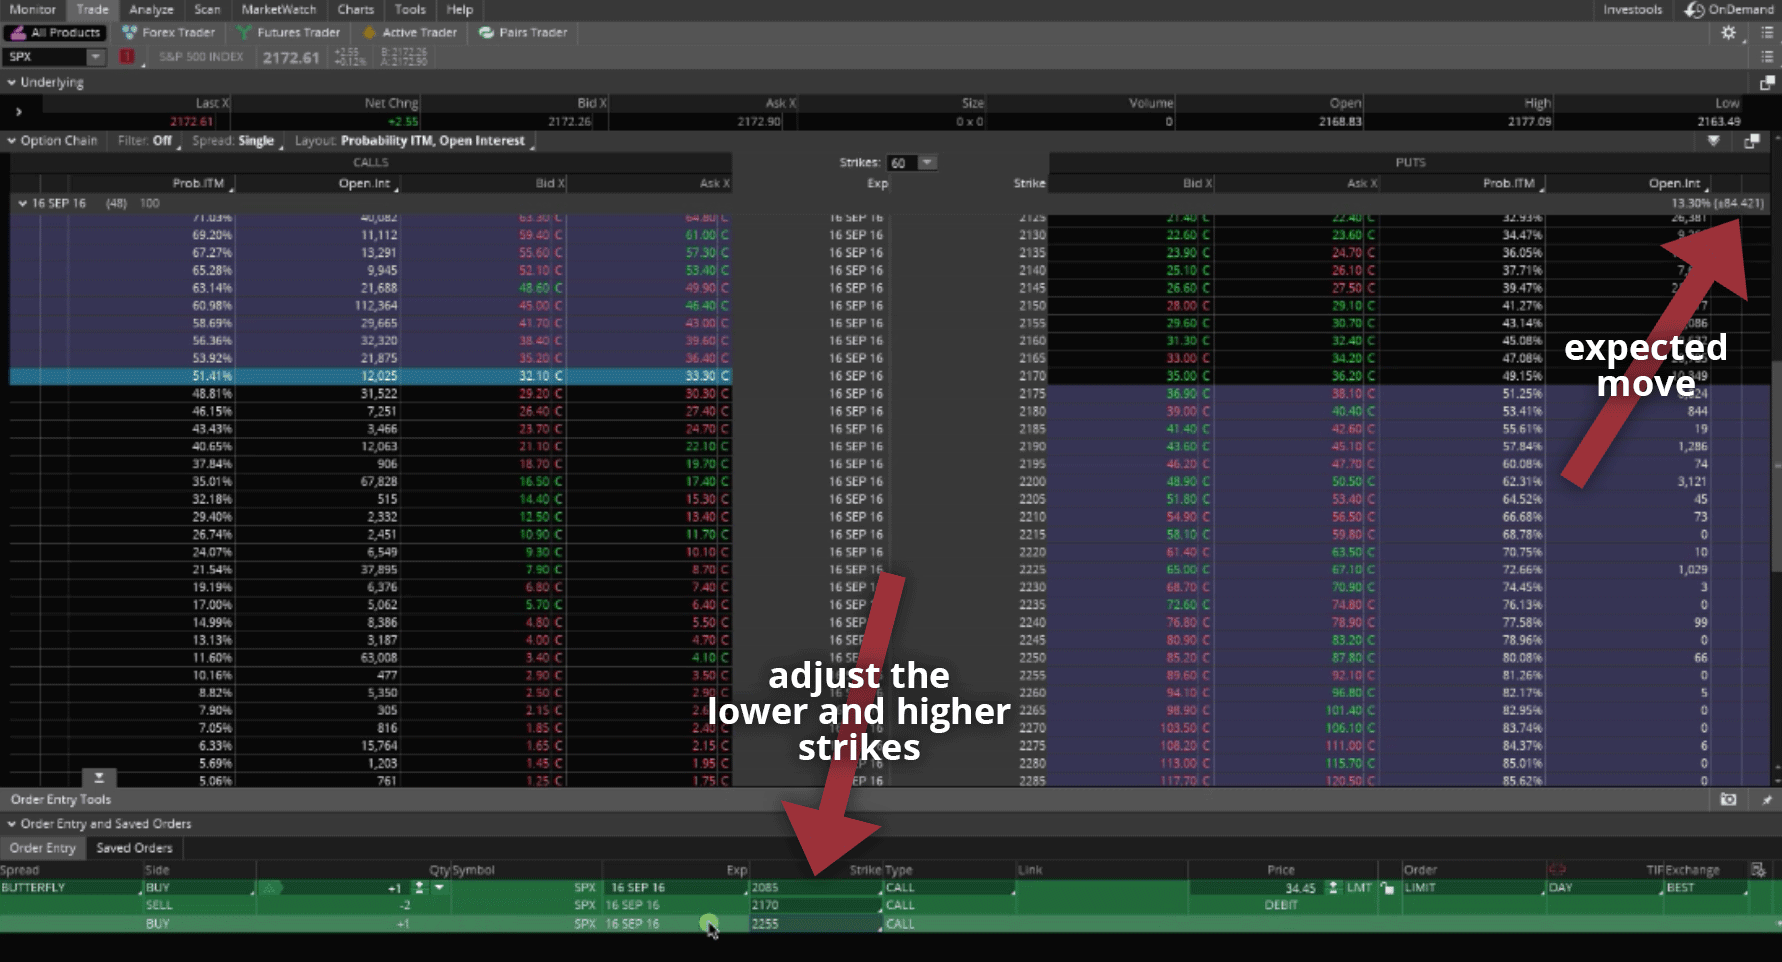

Again, we want our short strikes, the two in the middle, to be right at-the-money. We want the Call above and the Call below the short strikes to be whatever the expected move is.
Analyzing the Trade
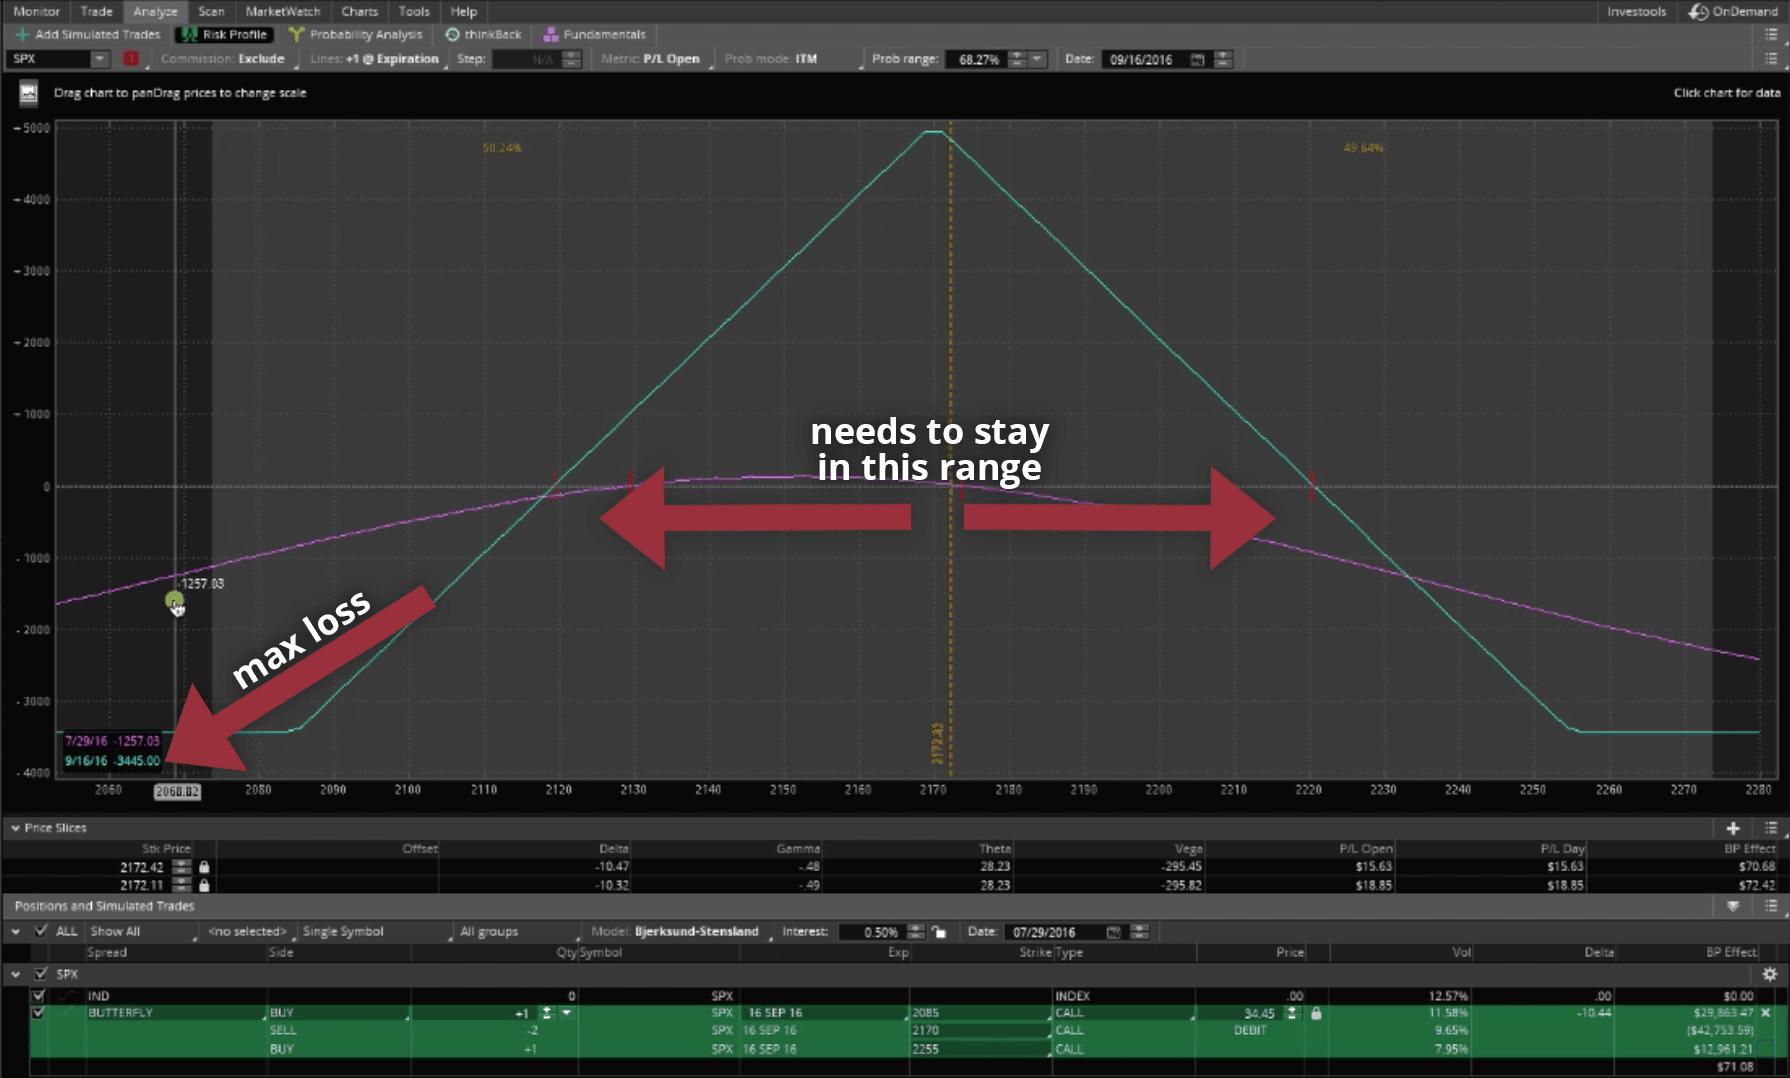
Just right-click on the order, and select “Analyze trade” to see a visual representation of our Butterfly.
If you look at the little black box in the bottom left corner of the graph, while I hover my mouse, the max risk that we have, on this trade is $3,445.
If the market crashed, that’s the most we could lose. If the market exploded to the upside, that’s still the most that we can lose. We want price to stay within a specific range, and take the trade off at a percentage of max profit. That’s how we profit from a Butterfly.

I hope this lesson has been helpful!
If you want to learn the step-by-step details of how to trade each of the strategies we teach at NavigationTrading, check out our 14-day Pro Membership Trial for just $1. You’ll get instant access to our VIP course training, including our Trading Butterfly Spreads for Income course.
You’ll also receive our NavigationALERTS via email and sms text message, not to mention, all the other Pro Membership resources and tools that come along with the 14-day trial.
We hope to see on the inside.
Happy Trading!
-The NavigationTrading Team

Follow