
Hey Everyone!
In this lesson, I want to compare an options Strangle and an options Straddle and discuss which one is better.
First, let’s review the similarities and differences between a Strangle and a Straddle, and then we’ll jump onto the trading platform and go over some examples.
There are two ways to enter a Strangle or a Straddle:
-
- Go short, where you are selling the spread to open
- Go long, where you are buying the spread to open
Short Strangles & Straddles
Similarities
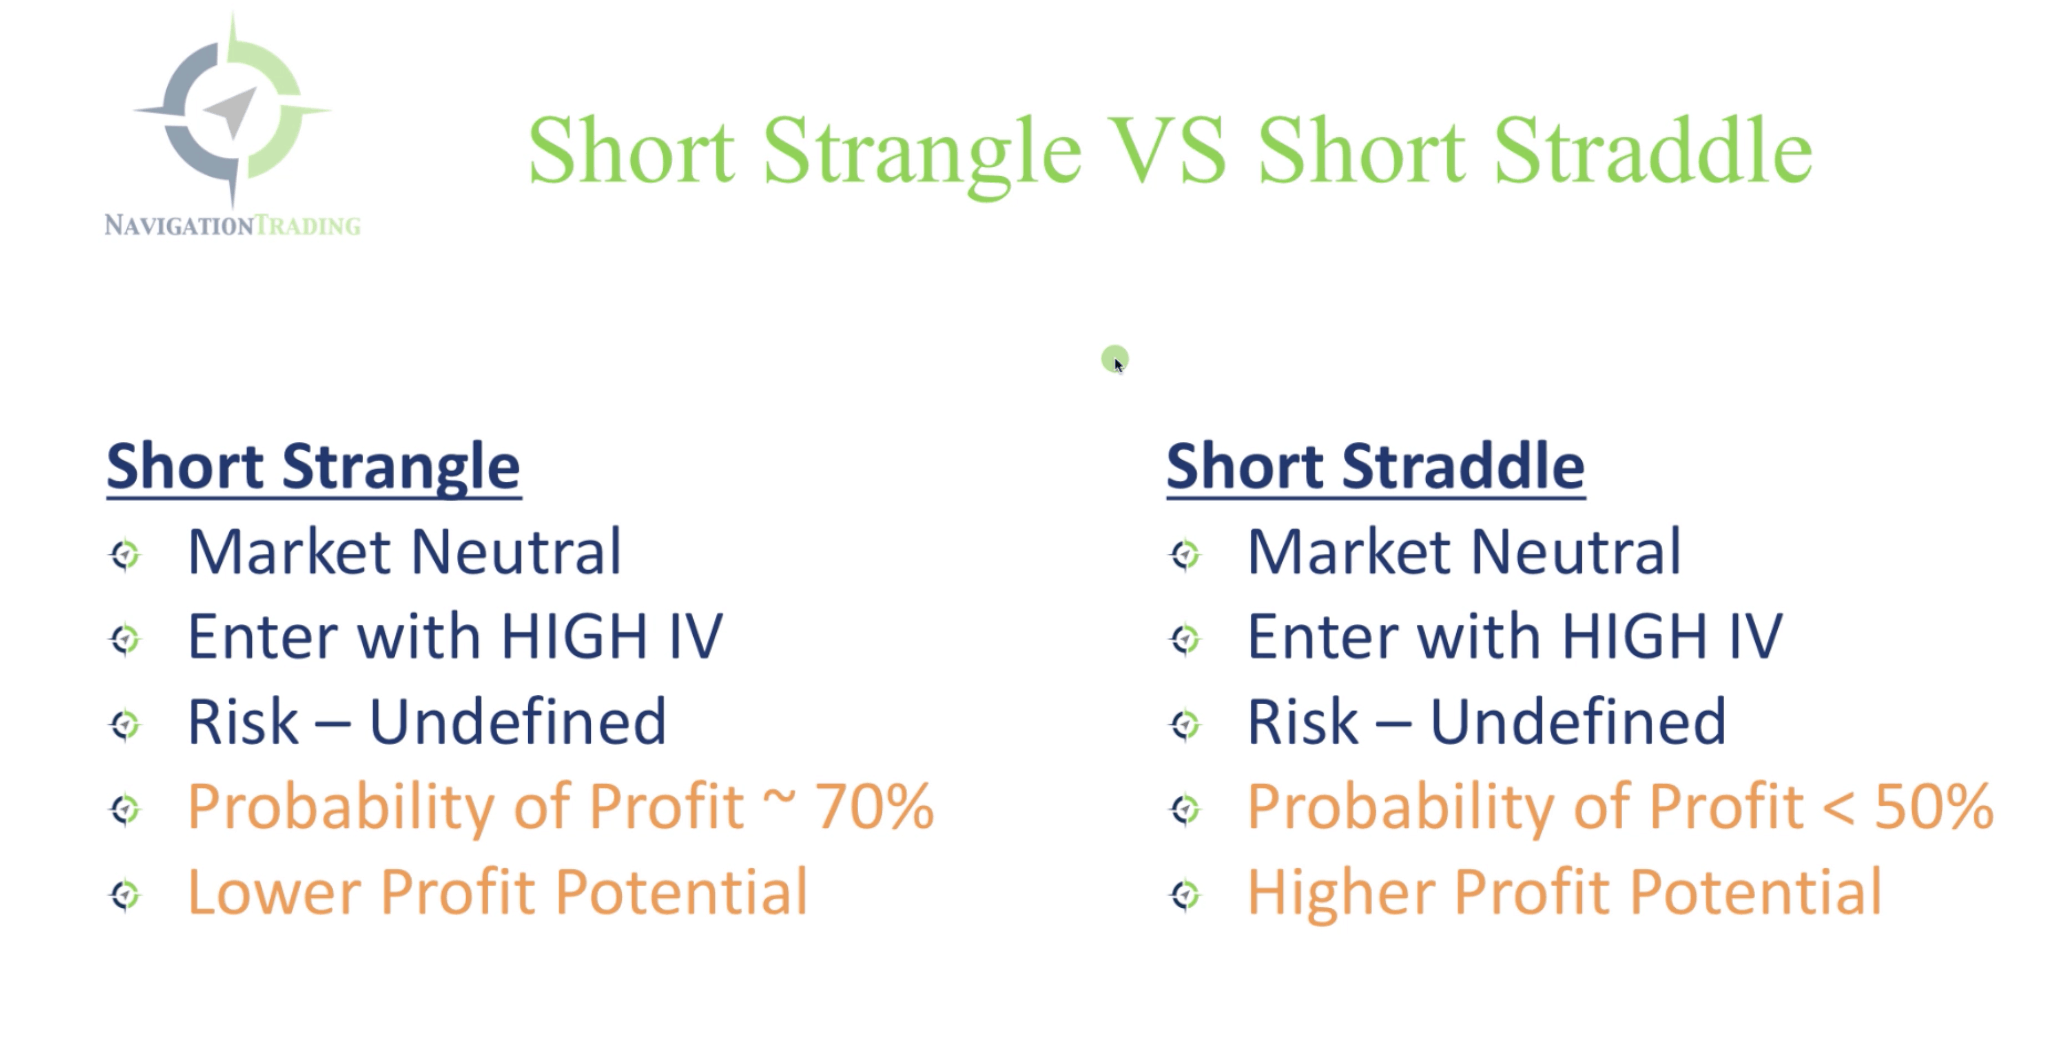
In both cases, we like to enter in a market neutral situation. We like to enter both a Strangle and a Straddle when implied volatility is high. Keep in mind, when you’re selling a Short Strangle or Straddle, the risk is theoretically undefined.
Differences
There are primarily two main differences to be aware of.
-
- With a Short Strangle, you’re going to have a little bit higher of a Probability of Profit (POP) on the trade, whereas with a Short Straddle, your probability of profit is going to be lower.
- Conversely, with a Short Strangle, you have a lower profit potential than with a Short Straddle, which has a higher profit potential.
Just remember, there’s always a trade-off between risk and reward. If your probability of profit is higher, then typically your profit potential is lower. And on the flip side, if your probability of profit is lower, then you should have a higher profit potential.

Trading Platform Example
Let’s go to the trading platform and take a look at an example.
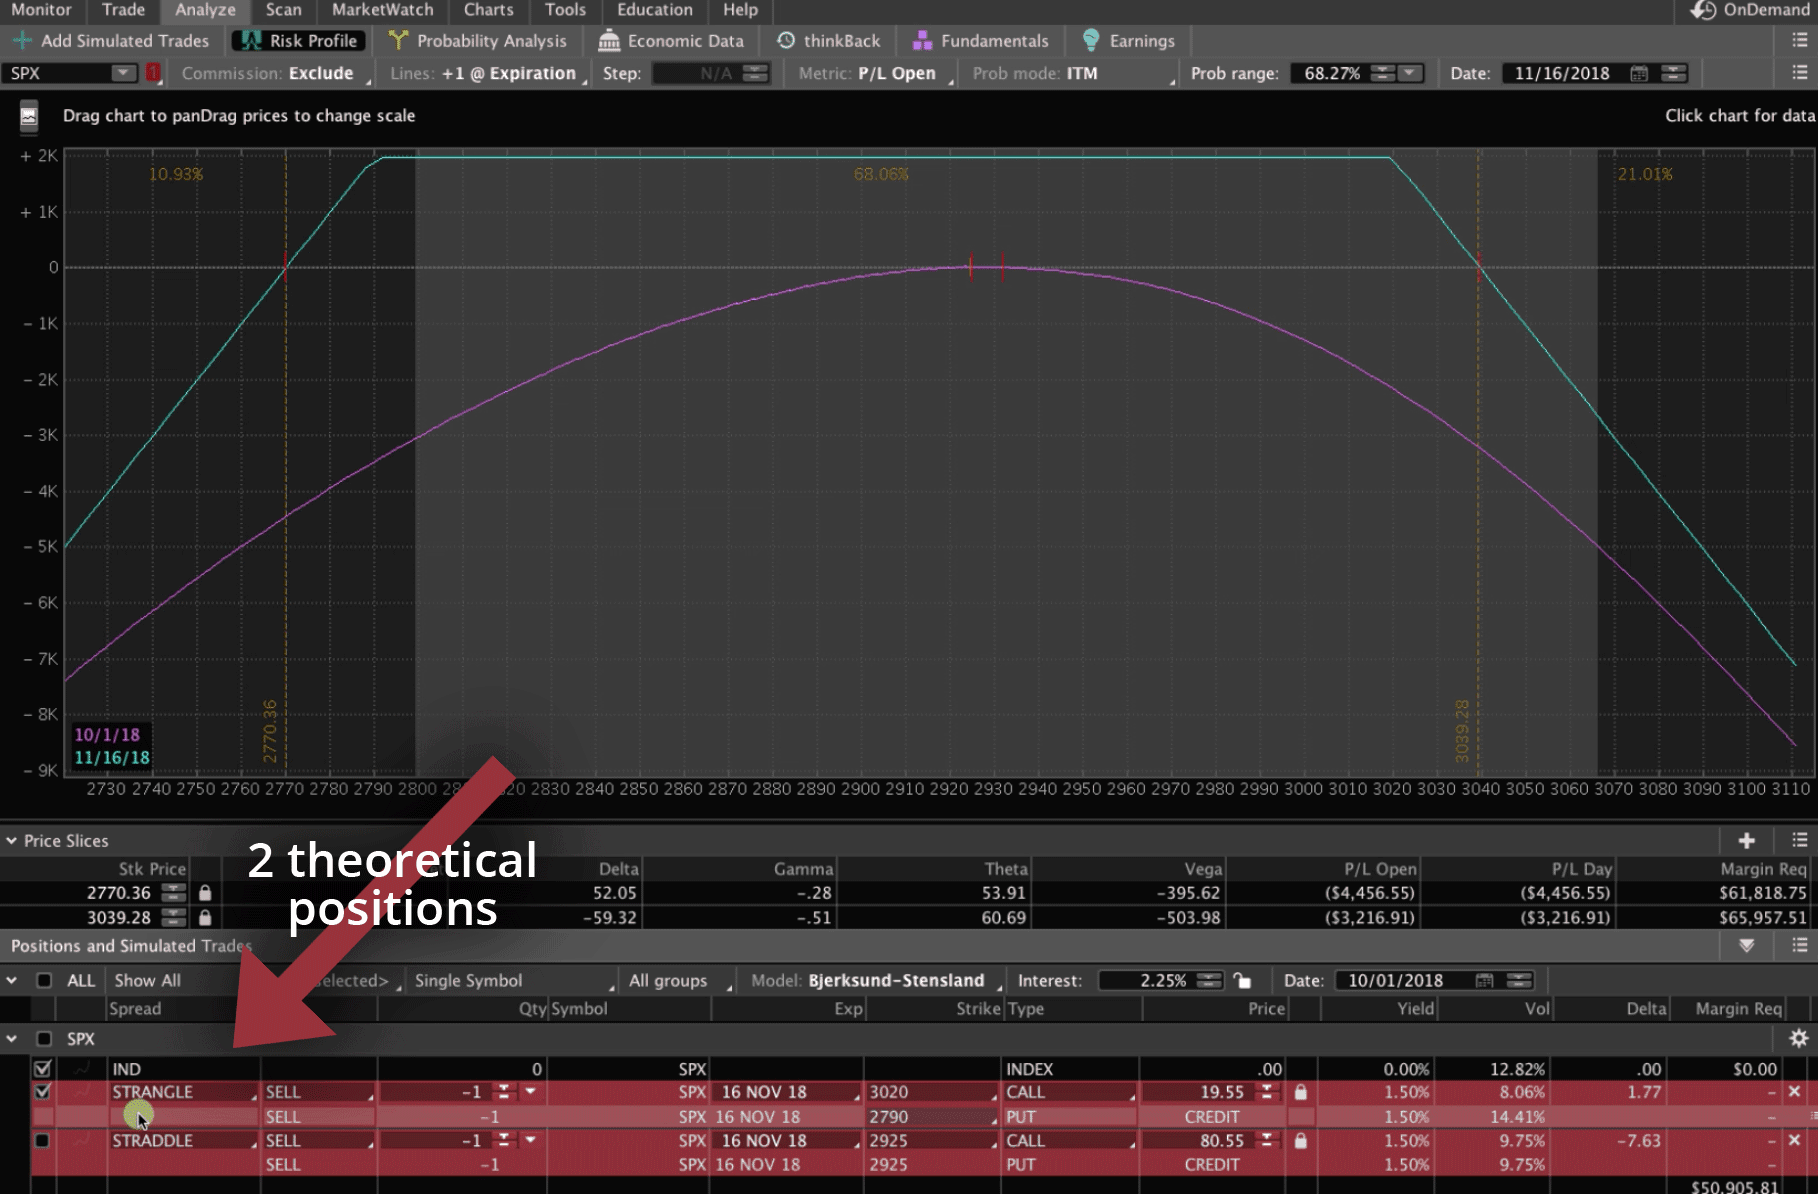
We are viewing the TD Ameritrade thinkorswim platform, and have set up two theoretical positions in the Analyze tab. The first position is a Strangle, and the second is a Straddle. The orders are colored red, indicating that they are short (selling to open).

Short Strangle
We’ve checked the box for the Short Strangle, so you’ll see the visual representation in the graph up above. On the graph you’ll notice a couple of things:
-
- We have our price slices set to our break-even points.
- We have our calendar set to the expiration date of these particular options.
By doing that, the platform gives us our probability of profit if we held this trade all the way to expiration, which in this case, is a little over 68%.
Now in reality, we are rarely going to hold these trades all the way to expiration, so our probability of making money on this trade in real life trading is much higher than 68%. But, for this example, if you were to hold it all the way to expiration, your probability of profit is just over 68%.
If you look at the little box with the teal numbers down in the bottom left hand corner of the graph, you can see that our max potential profit at expiration, is $1,955.
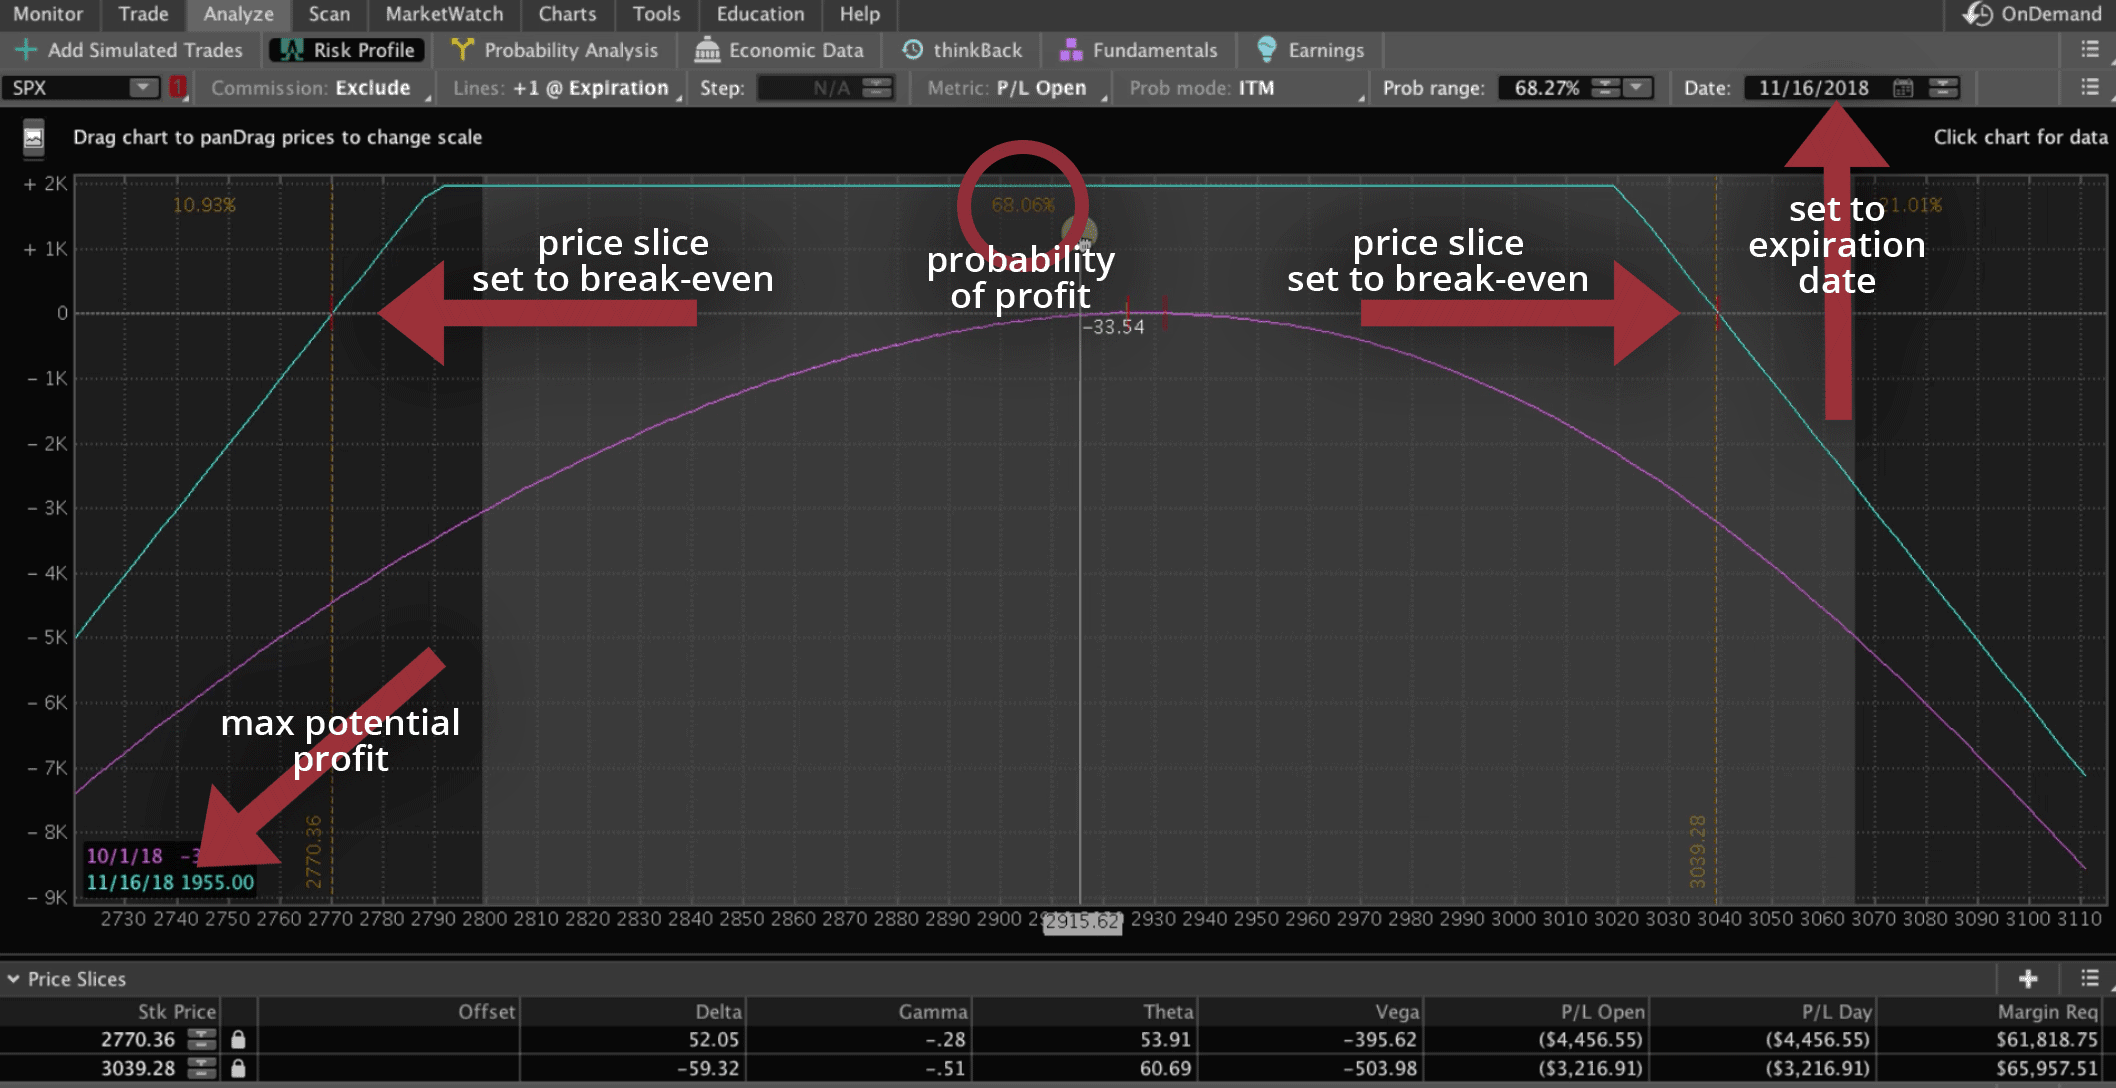

Meaning, if price stays within the break-even range, between now and the time that the options expire, we’re going to keep that entire $1,955.
Short Straddle
Let’s take a look at the Short Straddle for comparison.
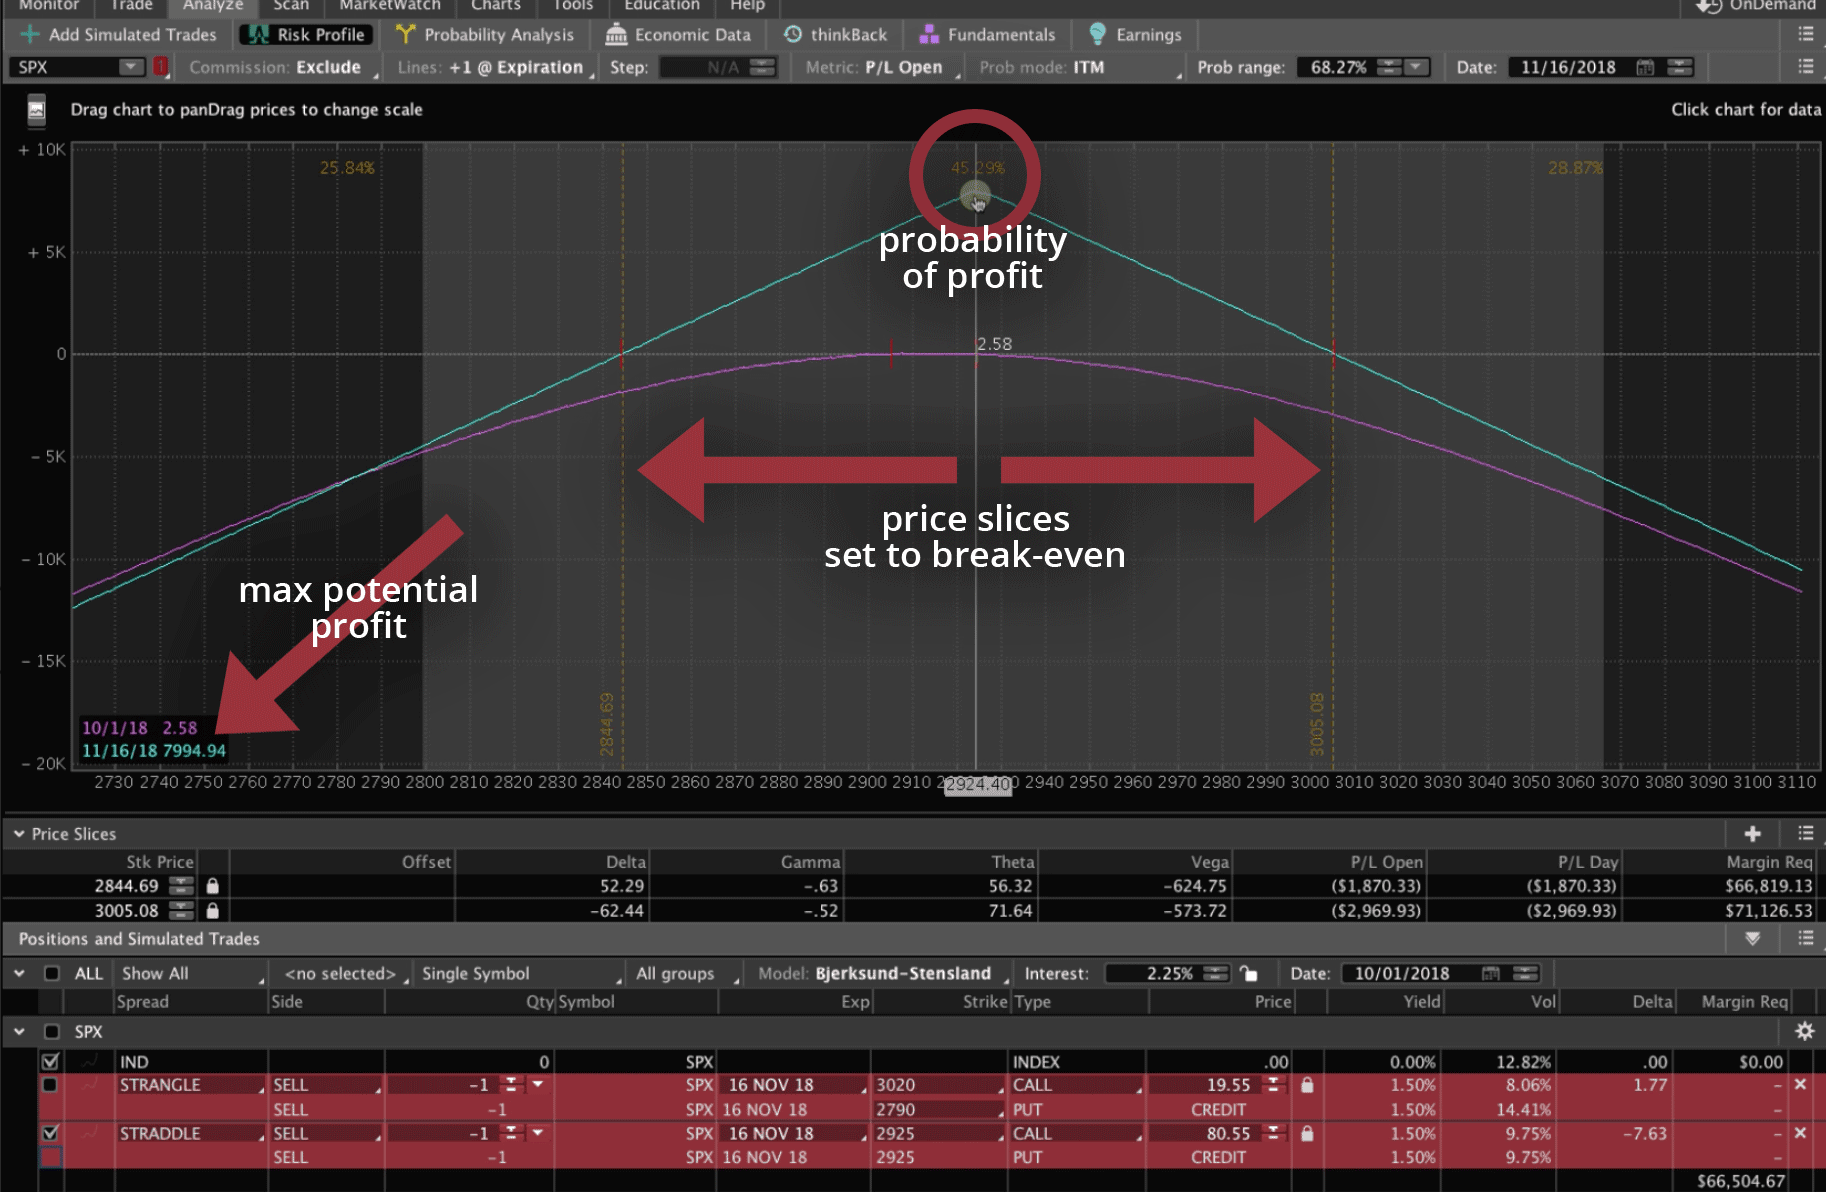
All I’m doing is unchecking the box next to the Strangle position, and checking the box next to the Straddle position. The visual graph will populate.
Instead of a long flat probability of max profit, now we have more of a tent shaped profit diagram. We have to take our price slices and move them to the break-even points to determine our probability of profit. Our probability of profit at expiration went from a little over 68%, down to just over 45%.
With a Straddle, we have a smaller range to make a profit in, but you can see the max profit that we can attain on this trade is a little under $8,000, if we pinned right at the short strikes.

Short Trading Takeaways
When trading Short Strangles and Short Straddles, one is not necessarily better than the other. It just depends on your underlying assumption.
If you think the underlying symbol is going to trade in a narrow range, then the short straddle would be the trade of choice.
If you prefer a much wider range during your time in the trade, then the short strangle would be your best choice.
At NavigationTrading, we definitely trade more Short Strangles than we do Short Straddles, because we prefer the higher probability of success, and we’re okay capping our profits at a lower potential.
Both short strangles and straddles have proven to be very profitable over time. It really just comes down to personal preference.
Long Strangles & Straddles
Now we’re ready to determine the difference between a Long Strangle and a Long Straddle.
Similarities
-
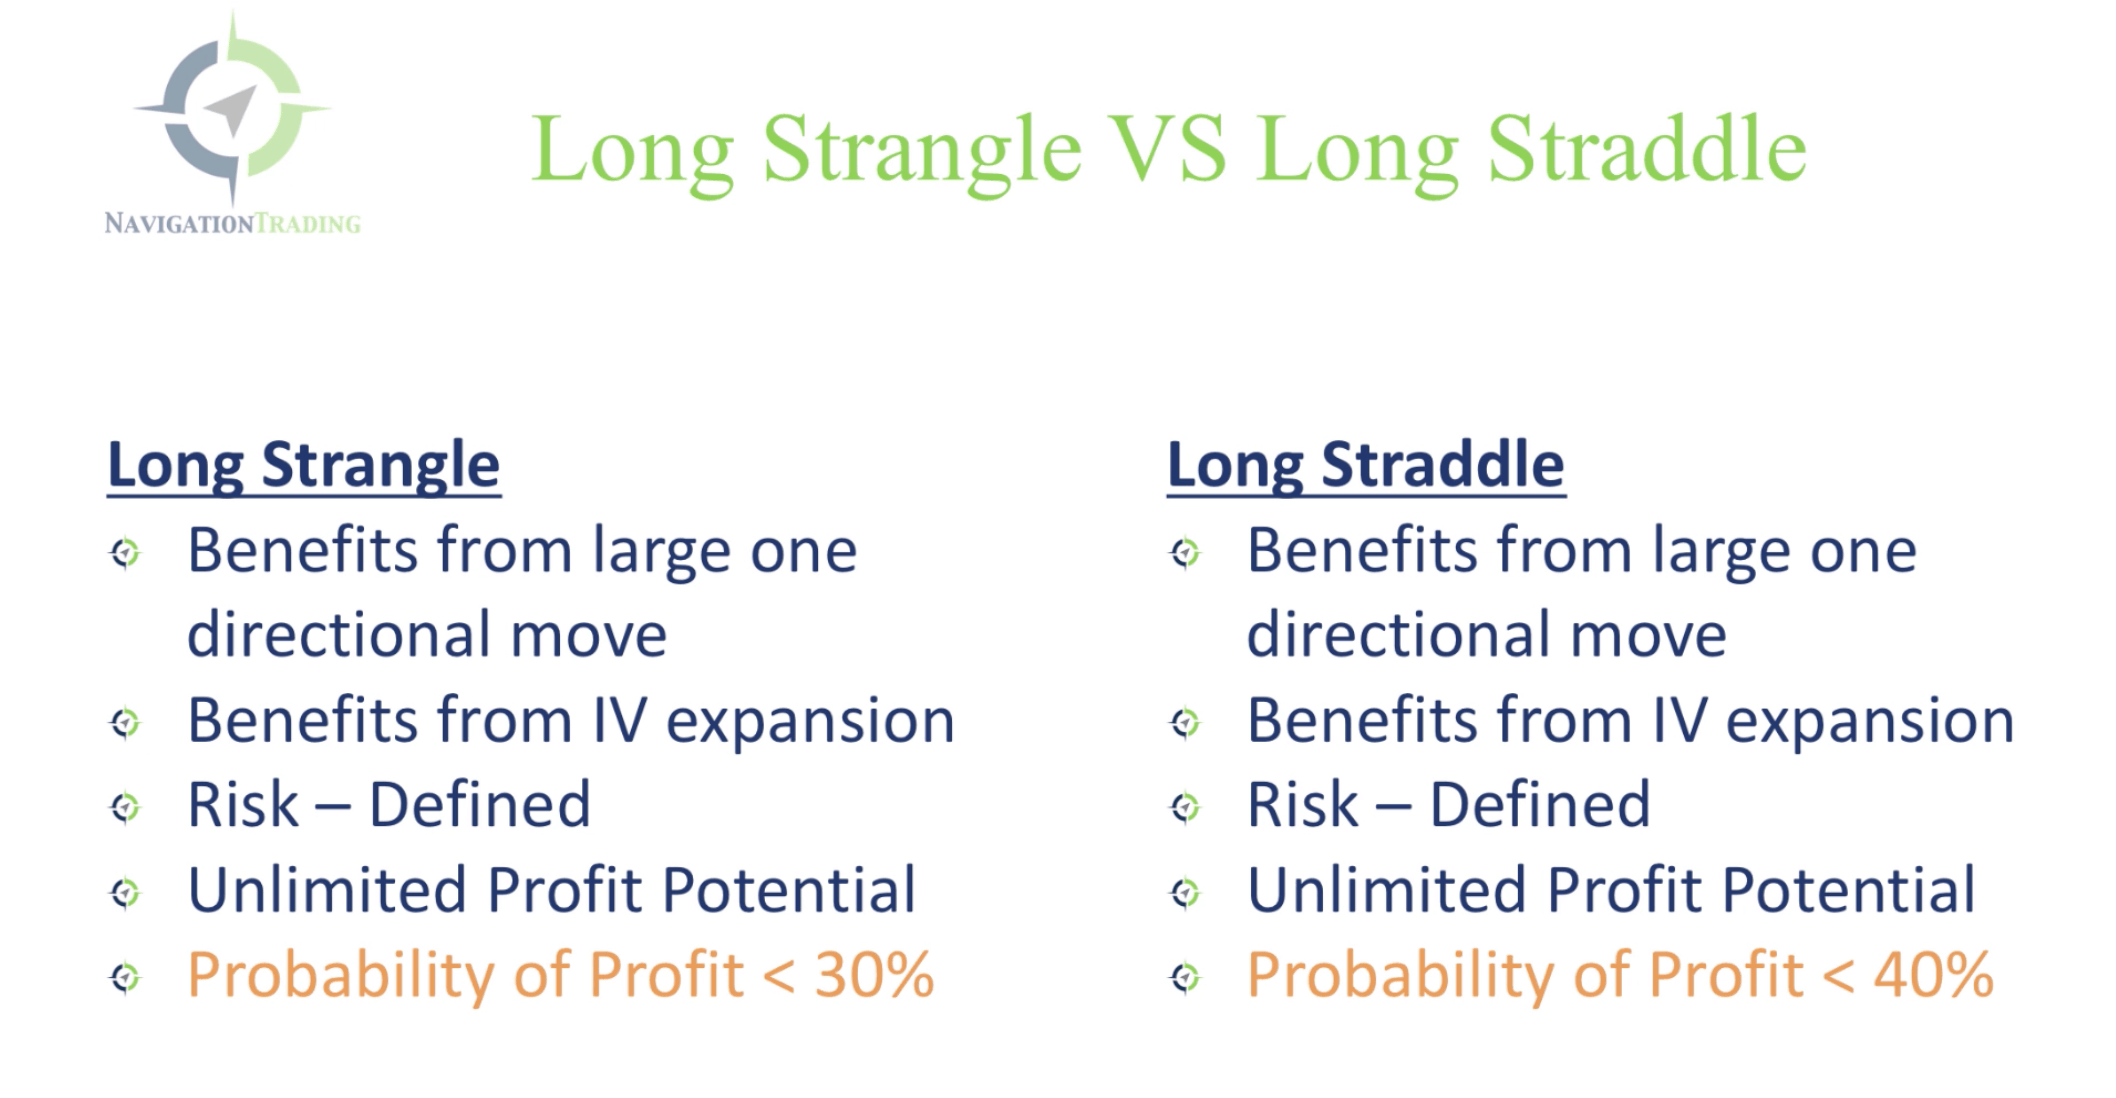
- Both a Long Strangle and a Long Straddle benefit from a large one directional move. If we put on a Long Strangle or a Long Straddle, we don’t care which direction it moves. We just want to make a large move.
- Both benefit from implied volatility expansion.
- The risk on a long straddle and a strangle are both defined.
- Both have unlimited profit potential.
Differences
The main difference between the two, is that the probability of profit on a Long Strangle is lower, and it’s a little bit higher on the Long Straddle.

Trading Platform Example
Let’s go back to the platform to take a look at an example.
This time, we’re looking at Amazon, ticker A-M-Z-N. I have the box checked for the Long Strangle, and you can see both of these positions are green, indicating that we’re entering a long position.
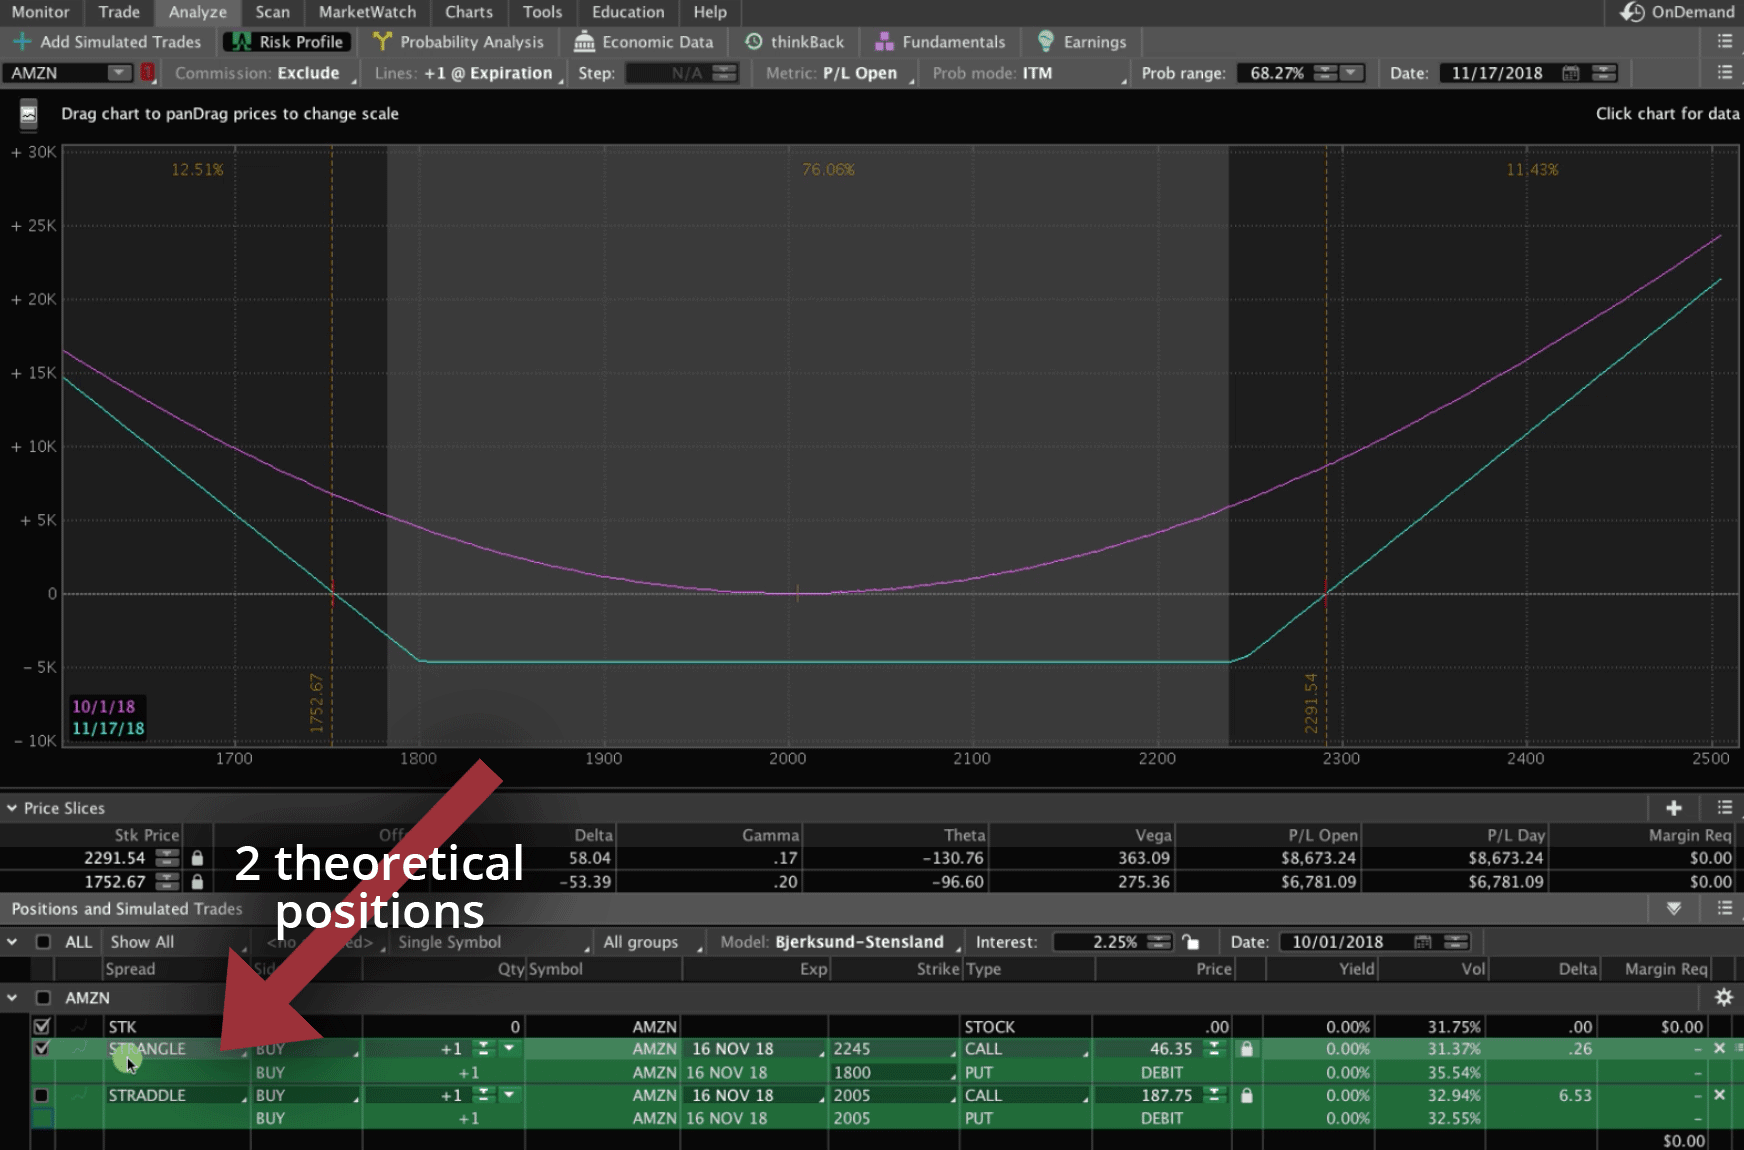

Long Strangle
If we look at the graph of the Long Strangle, you can see, we’ve set our price slices to the break-even points. You can also see that the risk is defined, the max we can lose on Amazon on a Long Strangle is $4,635.
Remember with a short strangle, how we wanted price to stay in between the break-even range to make a profit? In the case of a Long Strangle, we need a large directional move in one direction or the other, and we need to be outside of the price slices at the time of expiration to make any money.
In this example, we have over a 76% chance of losing money on this trade, and just a 24% chance of making money at expiration.


At NavigationTrading, the only time that we will buy Strangles and Straddles, is when we anticipate that implied volatility is going to be increasing and we anticipate a large move to happen fairly quickly. If price moves fairly quickly in one direction or the other, and we can get out before expiration, that’s what we’re looking when trading a Long Strangle or Straddle.
It’s a very low probability trade. For you to make any money, the price has to move very quickly, and in a large way.
Long Straddle
Let’s take a look at the Long Straddle.
If we uncheck the Strangle positon, and check the box for the Straddle position to populate the graph. Let’s move our price slices to the break-even points.
Now we have a probability just over 59%. If price stays between the break-even points, we’re still losing money over 59% of the time, if the position was held until expiration.
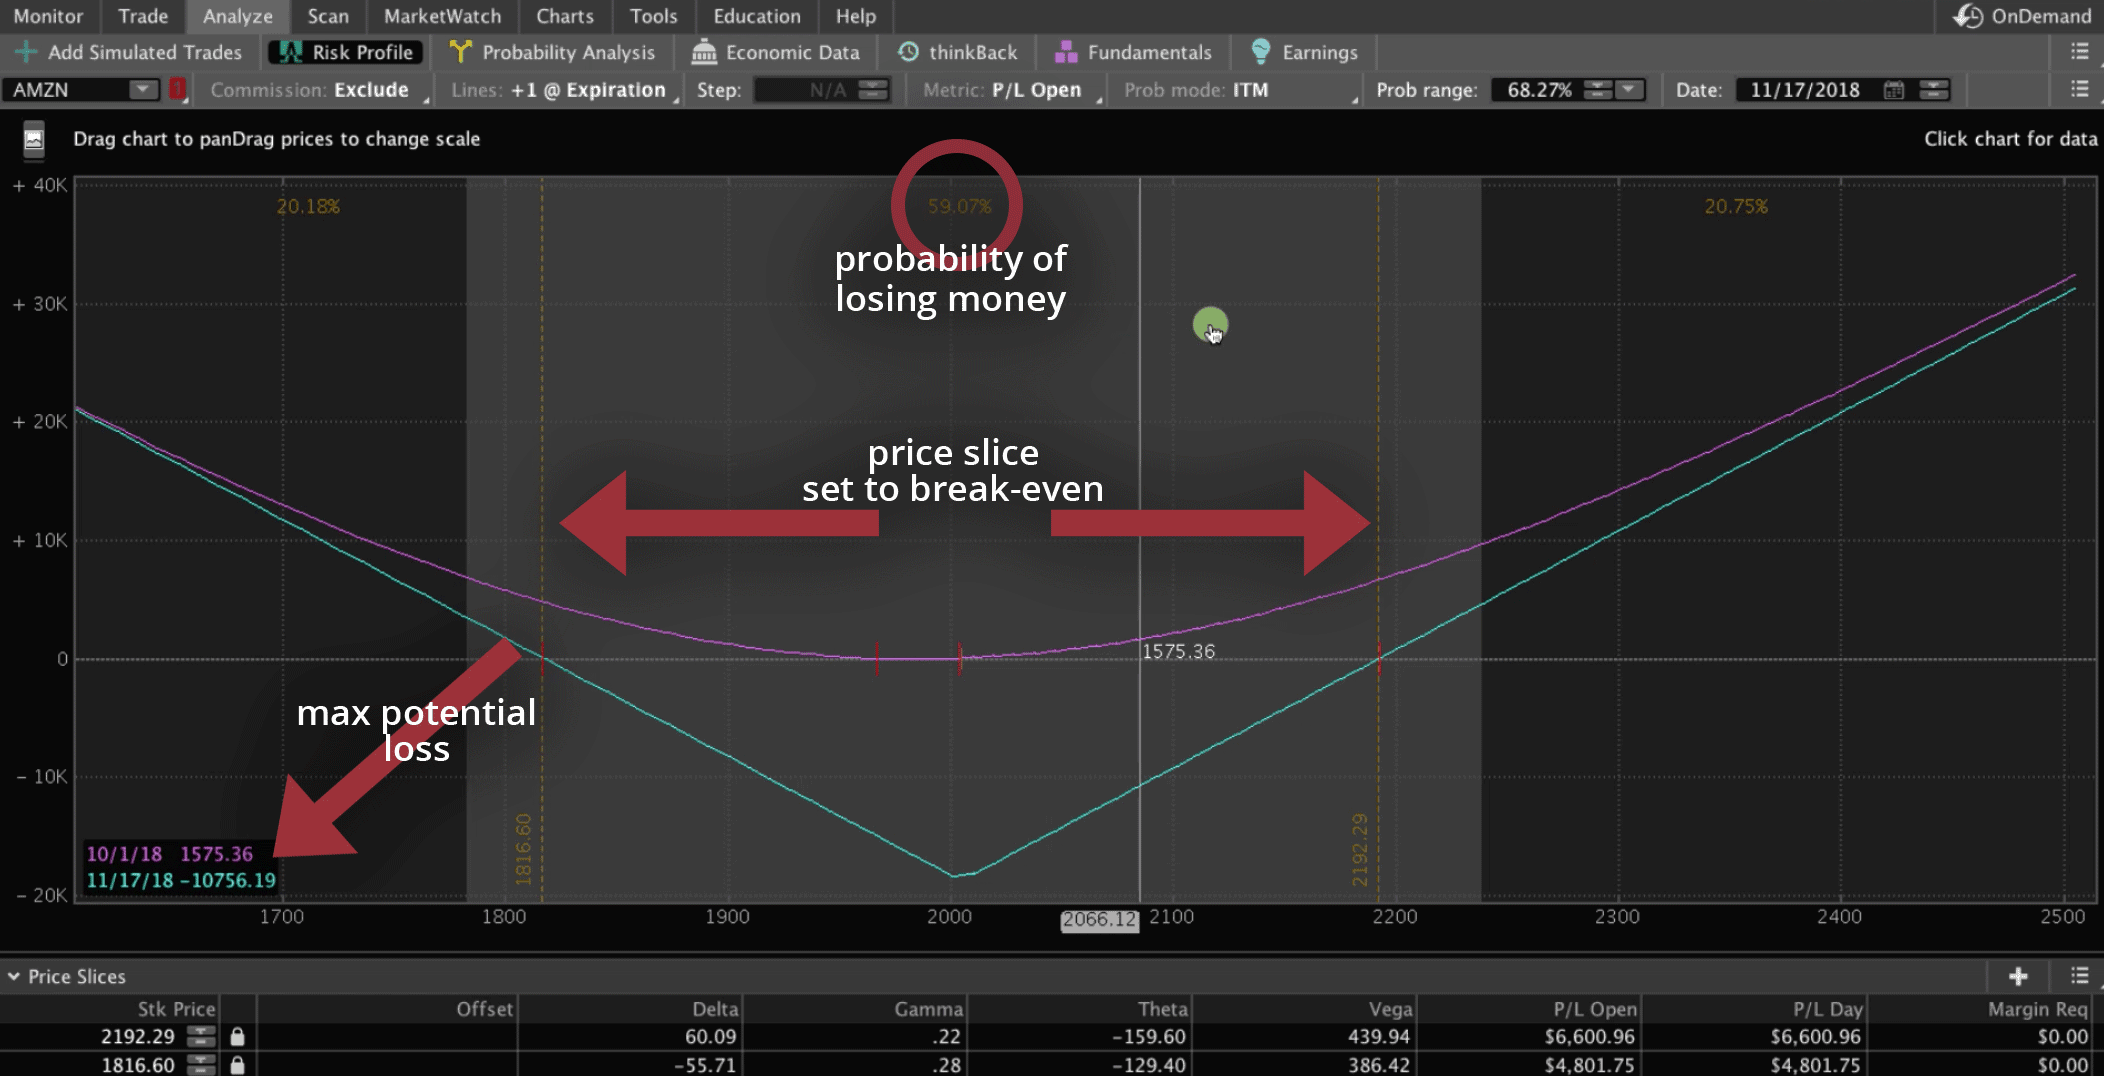

However, the range is more narrow. So, if we do have a decent move outside of those break-even points before expiration, that’s when we can profit on the Straddle.
Trading Takeaways
Similar to a Long Strangle, the Long Straddle is a lower probability play. We have a course called “How to Trade Options On Earnings for Quick Profits”, that covers trading options on Earnings announcements, which is one of the key areas that we utilize these types of strategies.
We typically don’t place this type of trade on an index or an ETF because of the probability of actually making money on those symbols is very low. We trade long strangles and straddles very sparingly, and it must be done on an individual stock with the anticipation of a large price move, AND implied volatility expansion.
I hope this lesson was helpful in determining whether to enter a Long Strangle or a Long Straddle, and whether to enter a Short Strangle or a Short Straddle.
If you want to learn the step-by-step details of how to trade each of the strategies we teach at NavigationTrading, check out our 14-day Pro Membership Trial for just $1. We hope to see on the inside.
To see more blog posts related to Strangles and Straddles, visit our blog category, “Trading Options for Income Strategies”.
Happy trading!
-The NavigationTrading Team

Follow