
Hey Everyone!
Welcome to another lesson from NavigationTrading.
In this lesson, I want to discuss Inverse VIX ETFs. There is a lot of confusion around Inverse ETFs in general, but I want to focus specifically on Inverse ETFs related to the VIX, because they are just a completely different animal.
Lesson highlights:
- What is the VIX?
- 6 Inverse VIX ETFs that you need to understand
- Concerns with trading Inverse VIX ETFs
- What is the alternative to trading Inverse VIX ETFs?
What is the VIX?
It’s a volatility index, or sometimes called the “fear index”. It was initially conceptualized back in the late ’80s, around the 1987 crash as a way to index uncertainty or fear in the marketplace.
Then, in the early ’90s, they updated the VIX with the ticker VIX, which it holds today. Starting in 2004, they started updating it daily and started utilizing the same calculations and methodology that we see in the index today.
A couple things to know about the VIX:
-
- It’s typically inversely correlated to SPX (S&P 500 Index). The VIX is priced based on options of the SPX. When the S&P 500 is going up, typically the VIX is going down. When the S&P 500 is going down, and there’s more uncertainty in the marketplace, many times you’ll see a spike higher in VIX.
- You can’t trade shares of VIX, because it’s an index, just like SPX or RUT. However, it does have options that are tradable, and they’re extremely liquid. The pricing of the VIX options are based on the price of the VIX futures.
Just to recap, the price of the VIX is based on options of the SPX. But, the price of the VIX options are based on the price of the underlying VIX future’s contracts. If that sounds confusing, I know, it is, and that’s exactly why we created an entire course all about trading the VIX. It’s called “How to Trade the VIX with 92.3% Accuracy”. The course is included as part of your V.I.P. course training when you join our Pro Membership. It provides all the details that are beyond the scope of this video.
Platform Examples
Let’s jump onto the platform and discuss the topic of this lesson, which is Inverse VIX ETFs. Here’s a list of six different Inverse VIX ETFs:
- ZIV
- EXIV
- VMIN
- XIV
- XIVH
- SVXY
All of these Inverse VIX ETFs are calculated a little bit differently. Let’s take a look at the platform and I’ll show you exactly what I mean.
ZIV
We’ll start with ZIV. If you look up at the top of the ThinkorSwim platform, you can see that this one is managed by Credit Suisse, and it’s an ETN, or Exchange Traded Note.
Below is a price chart going back about a year and a half. At the time of this post, it’s September 27, 2018. What you’ll notice, if you look all the way through 2016 and 2017, when the market was rallying, you could see implied volatility continue to contract, therefore an Inverse VIX ETF did very well.
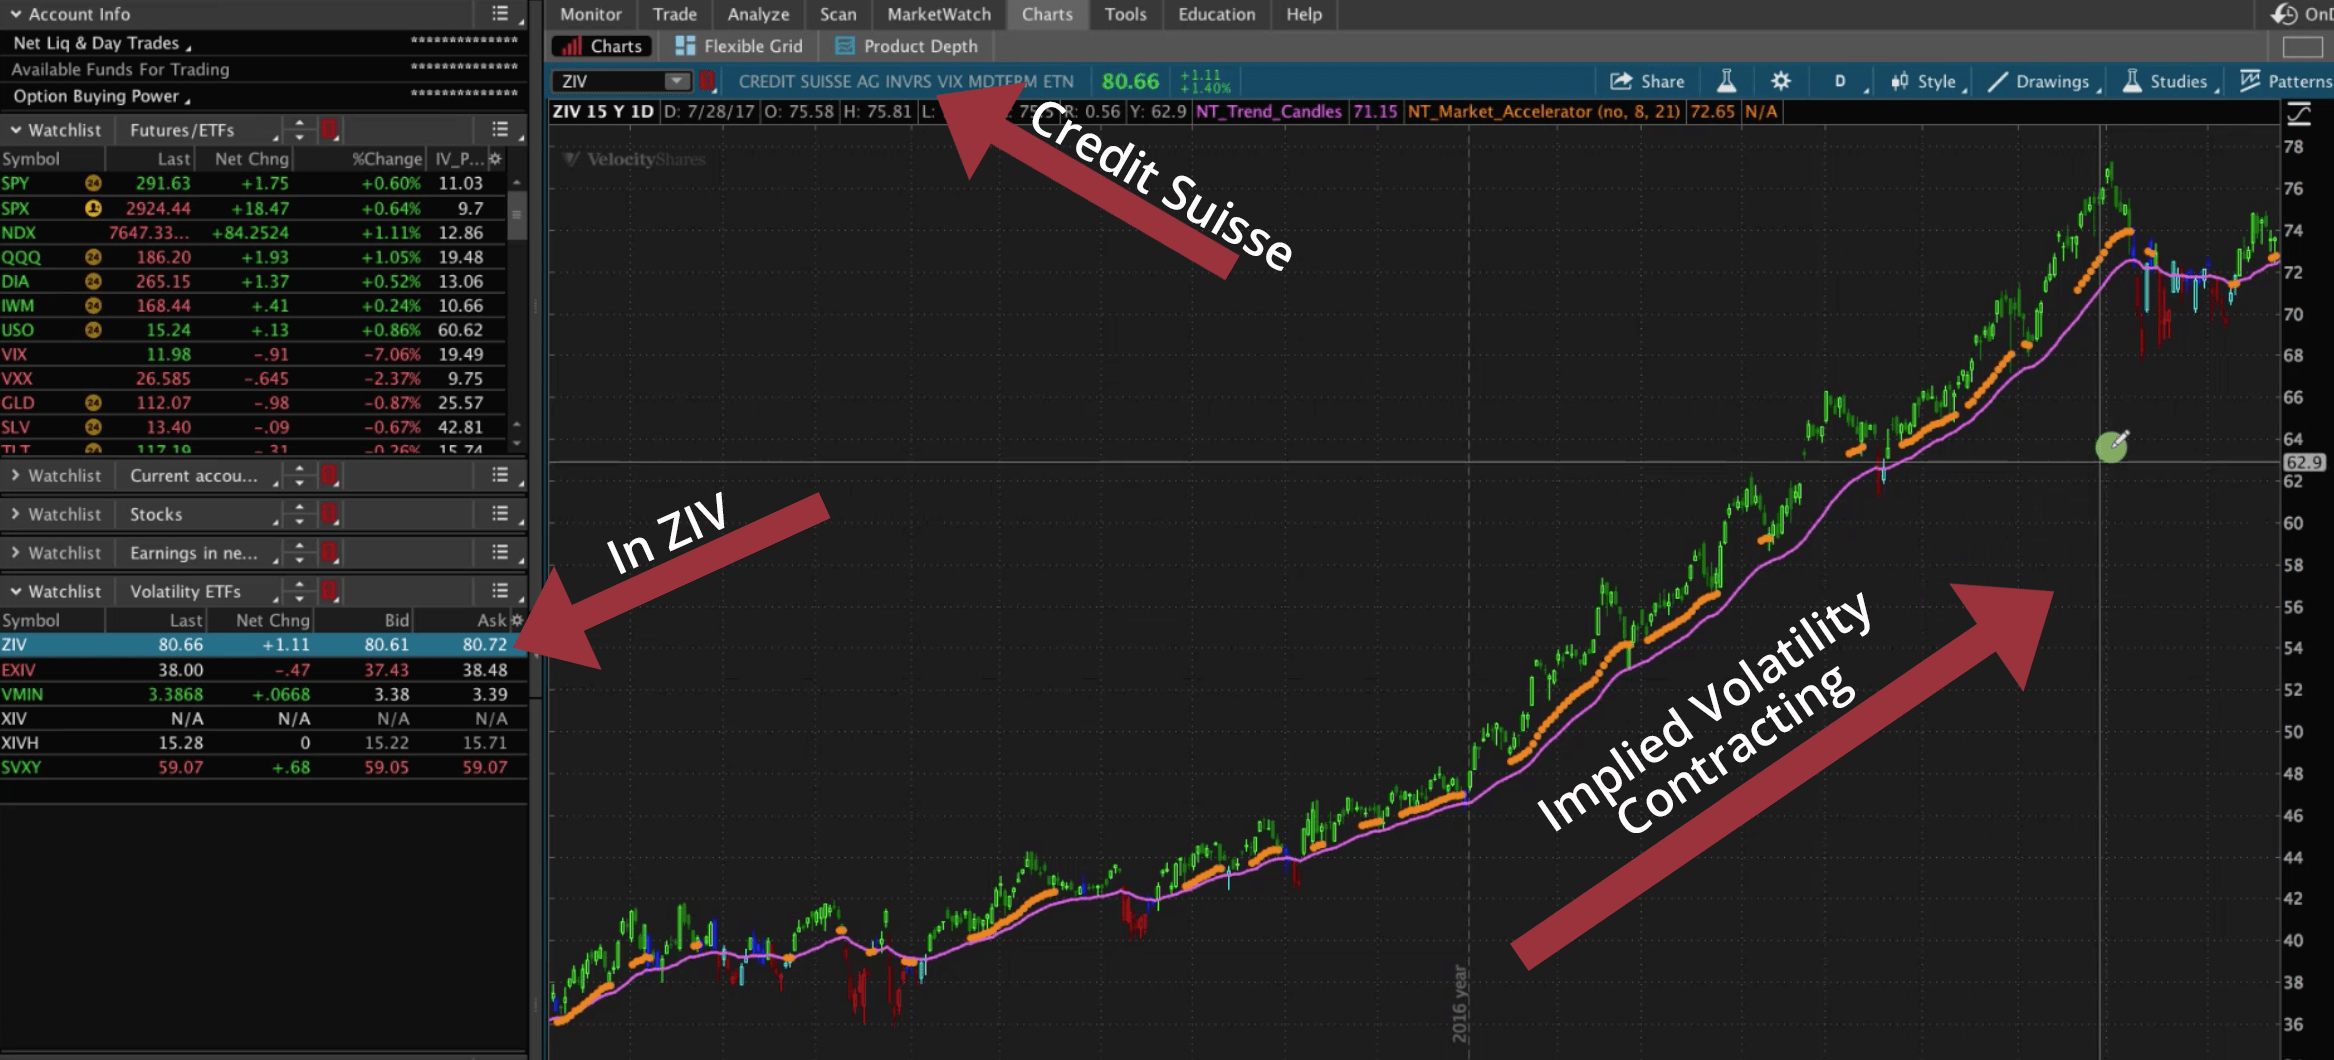

In fact, there were hedge funds and multiple other funds designed around this strategy of simply selling volatility or buying Inverse VIX ETFs. On February 5th of this year, we saw the market go down over 10% and the VIX exploded, increasing about 115%.
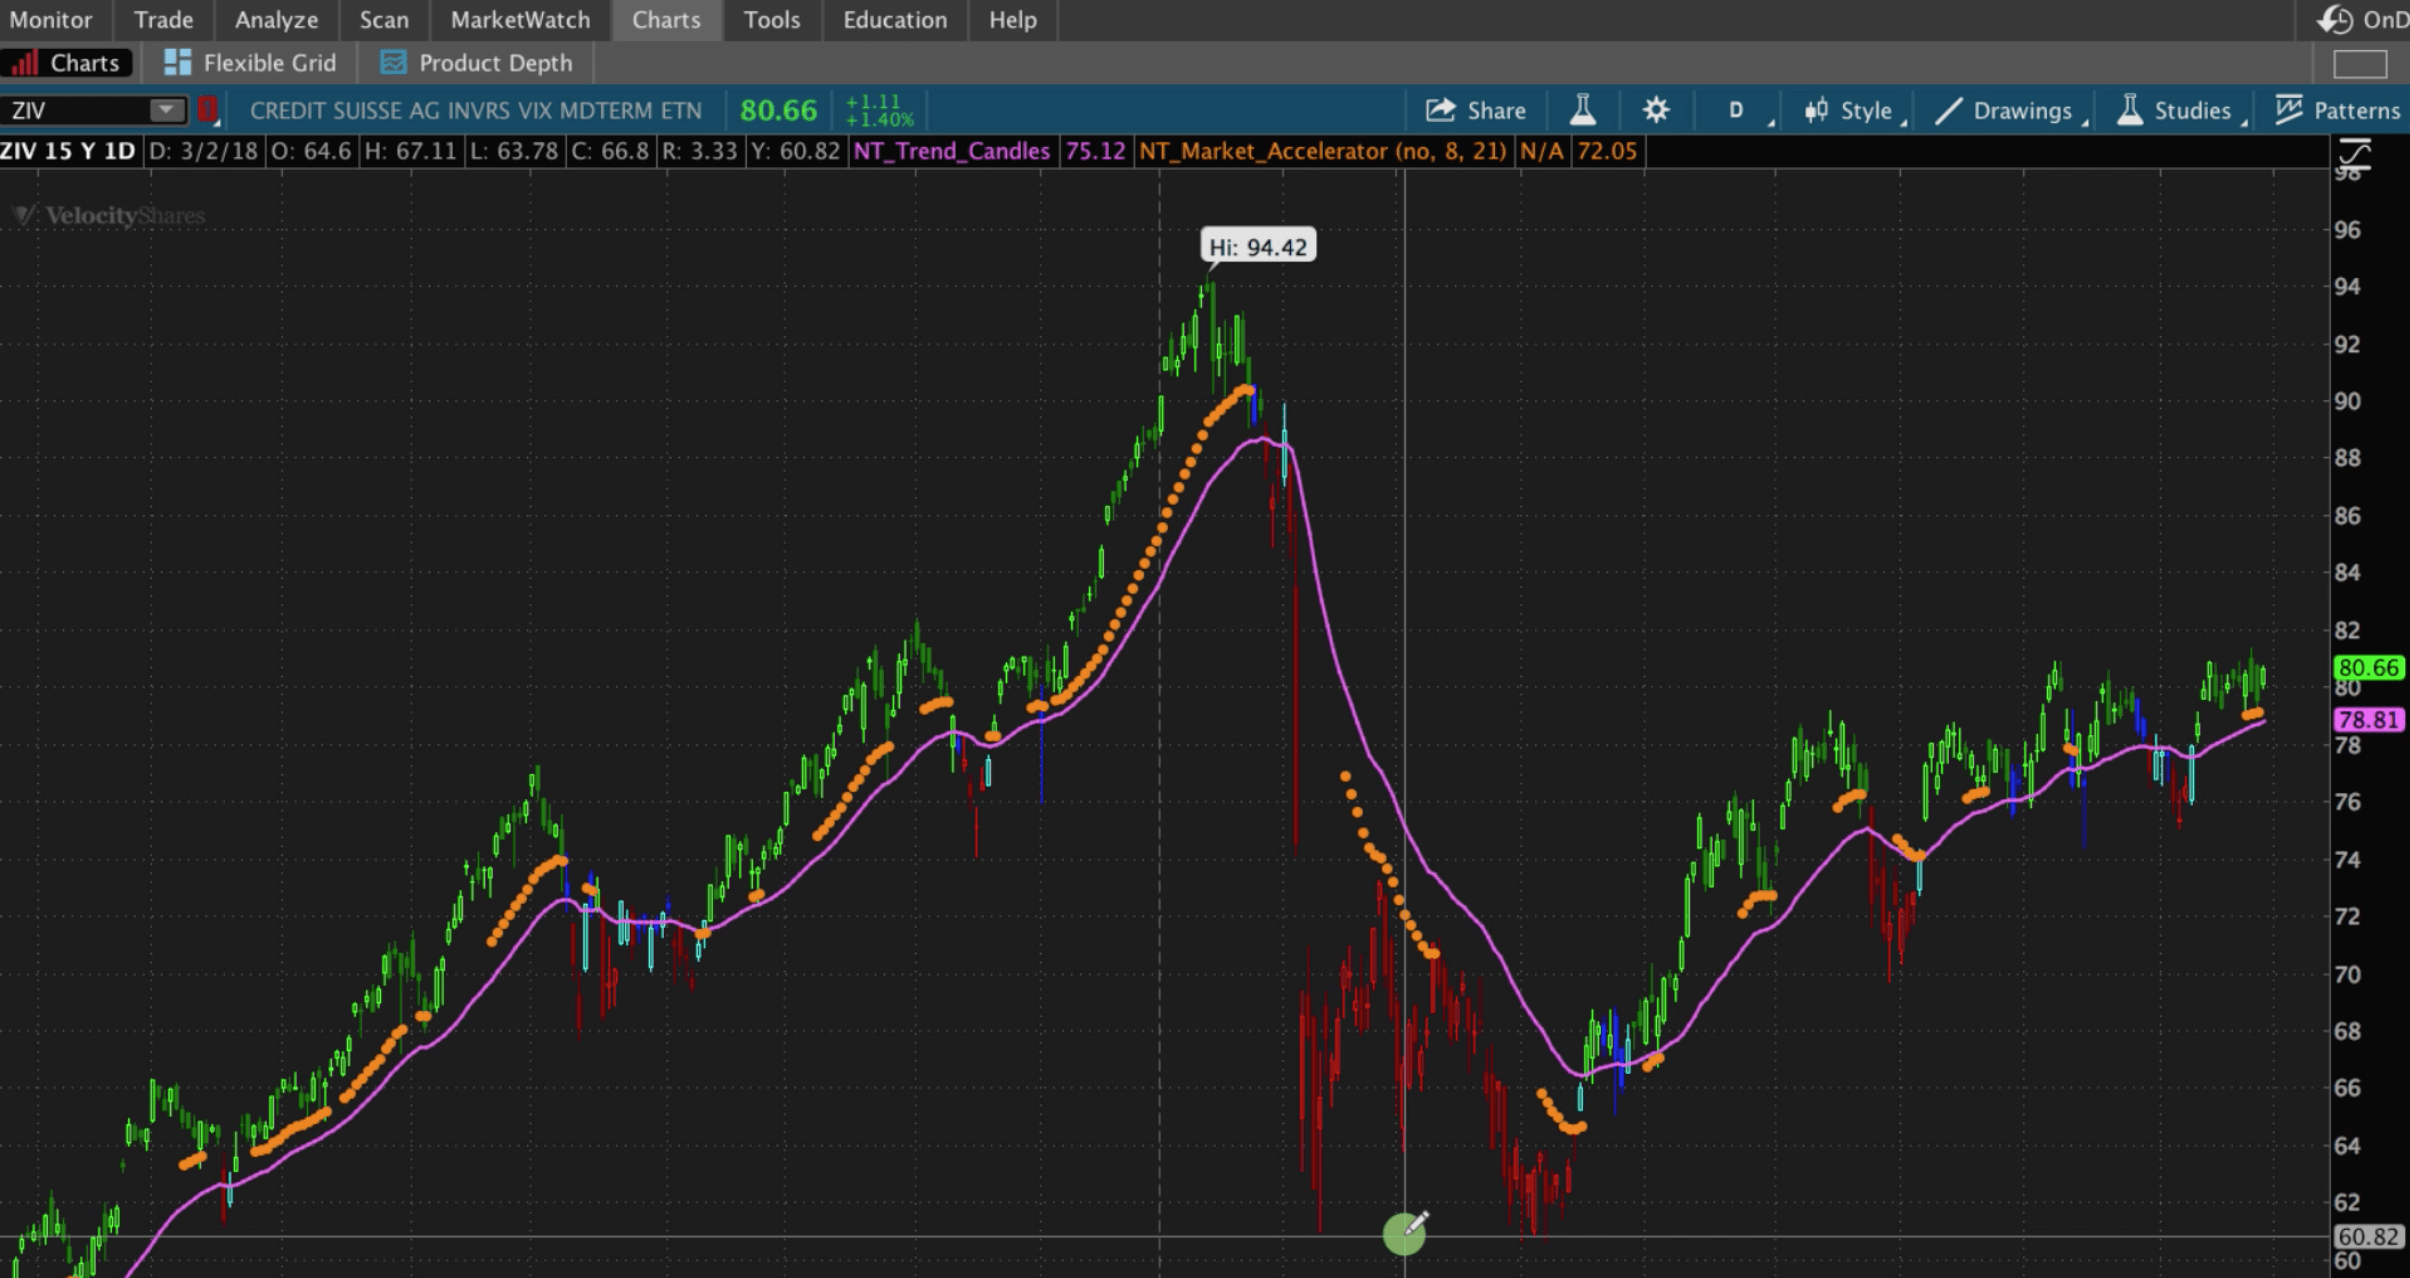
Look what happened to this inverse ETF, it had a high of $94, and within just a matter of days, you can see it bottomed out at around $60. So it lost nearly 30% of its value in just a couple weeks.

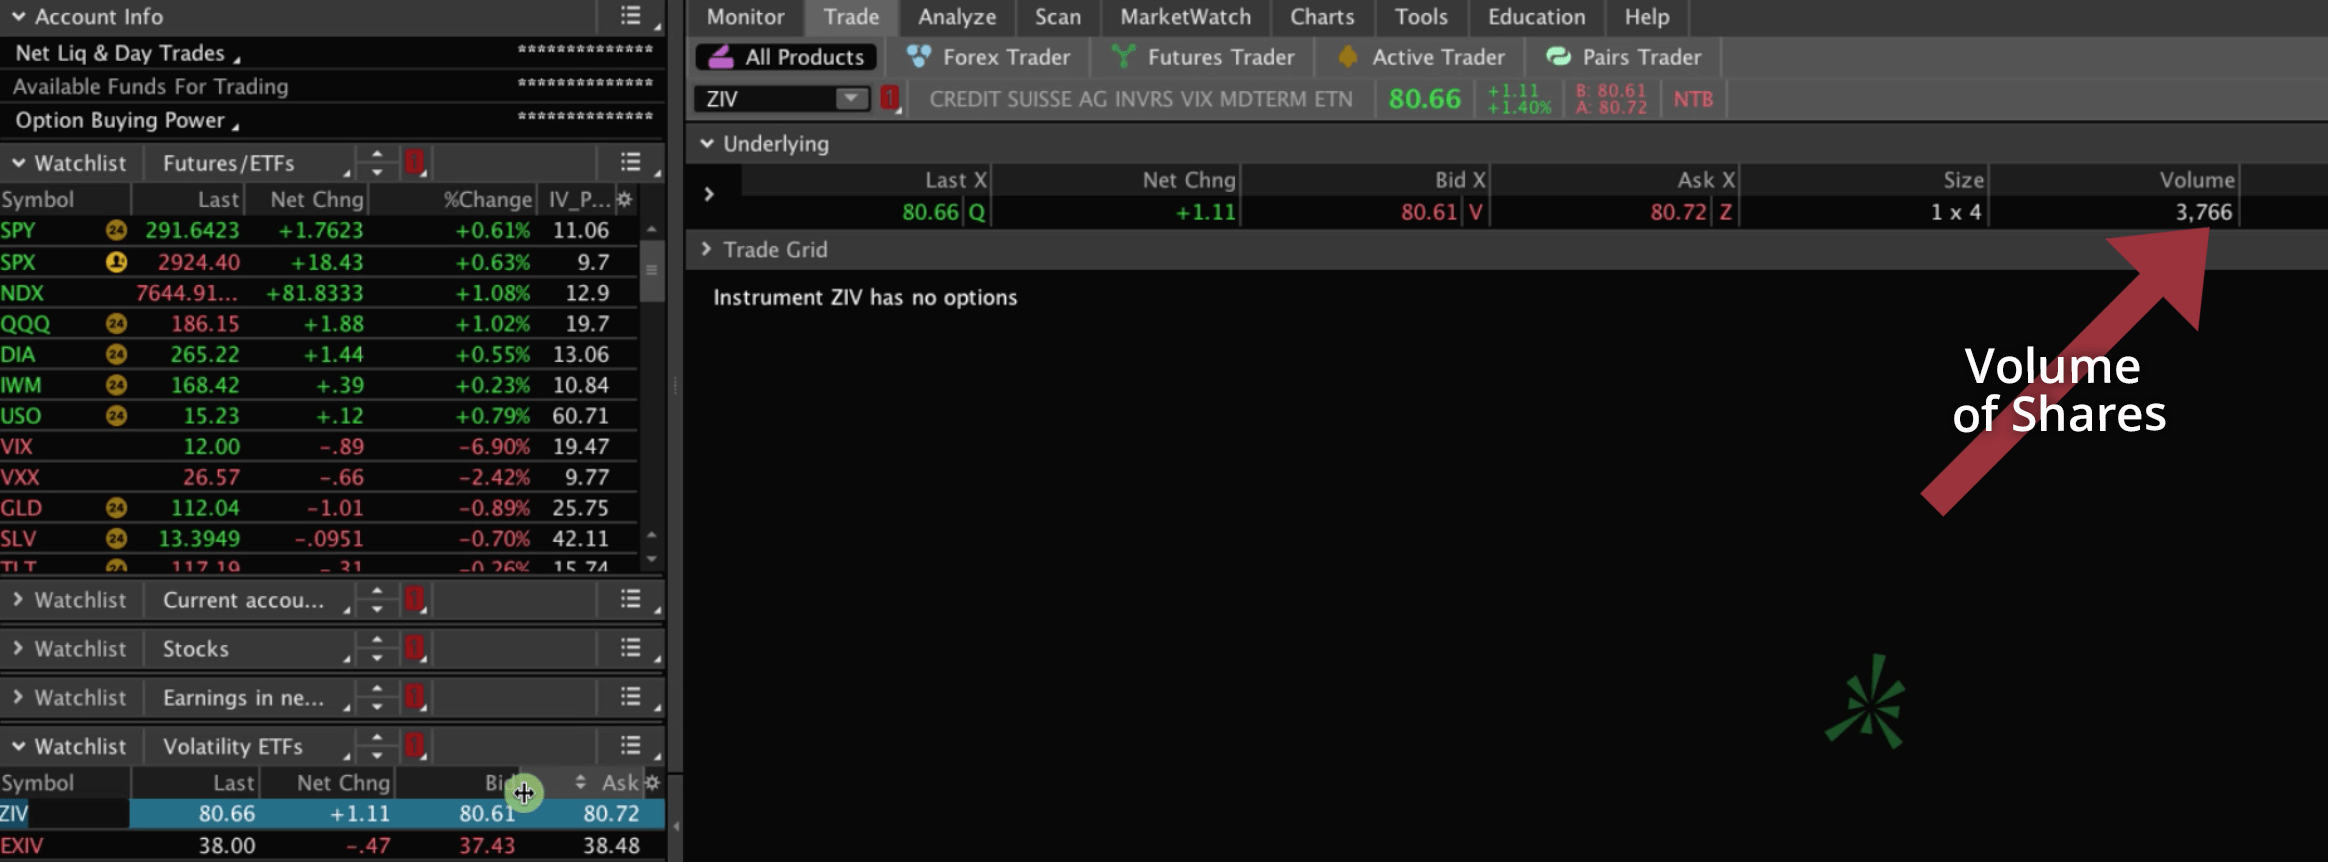
One of the other things that we always want to be aware of, is does this symbol have options and are they tradable?
In the case of ZIV, it doesn’t even offer options to trade. As you know, at NavigationTrading, we’re all about trading based on statistics and probabilities, utilizing options to make those trades.
Also, the volume is very low. Only 3,766 shares have traded on this day.

EXIV
Let’s take a look at the next one, EXIV. EXIV has no options either.
If you look at the volume of shares traded, we’re talking about less than 500 shares traded in one day.
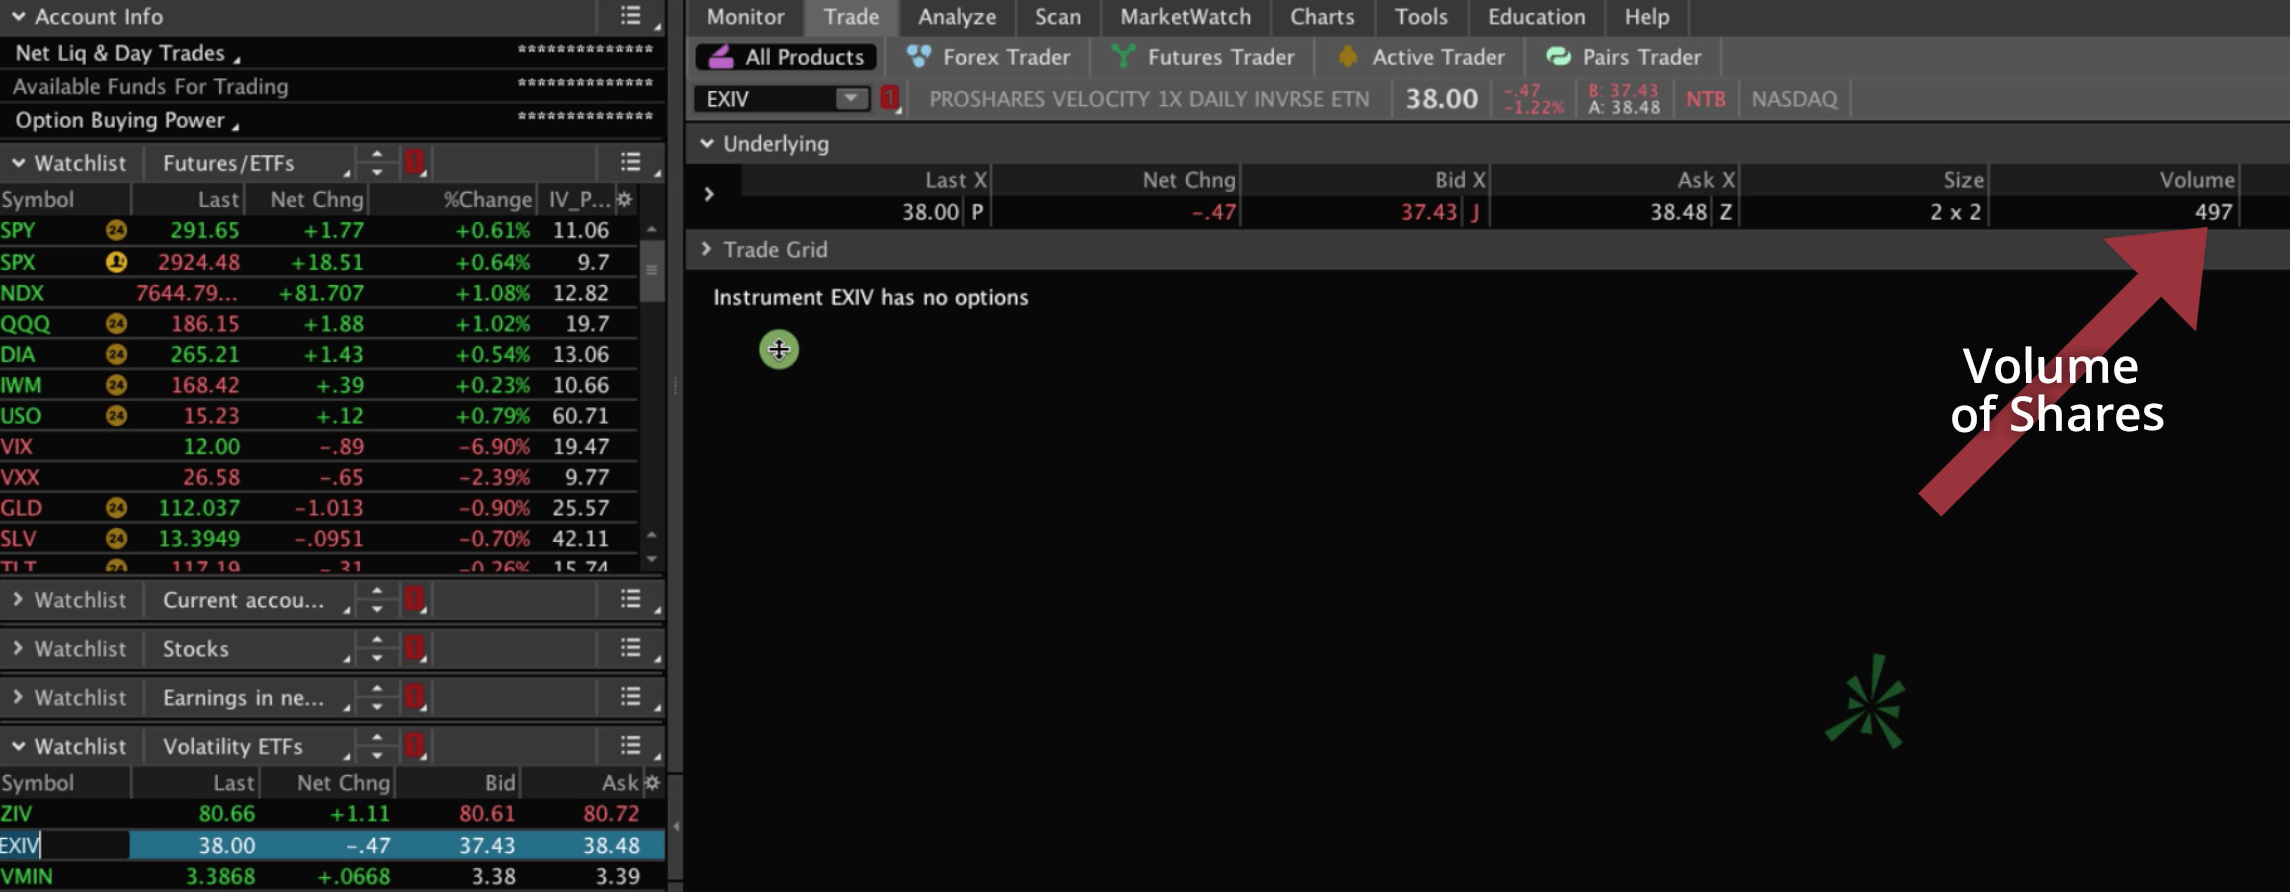

These are symbols that I wouldn’t trade, because they could be difficult to get in and out of with very wide bid-ask spreads, which eat directly into your profits.
Let’s take a look at the chart of EXIV. During that same period, in early February, there was a high of $61, and it got down to under $30, so it lost over 50% of its value in just a couple of weeks.
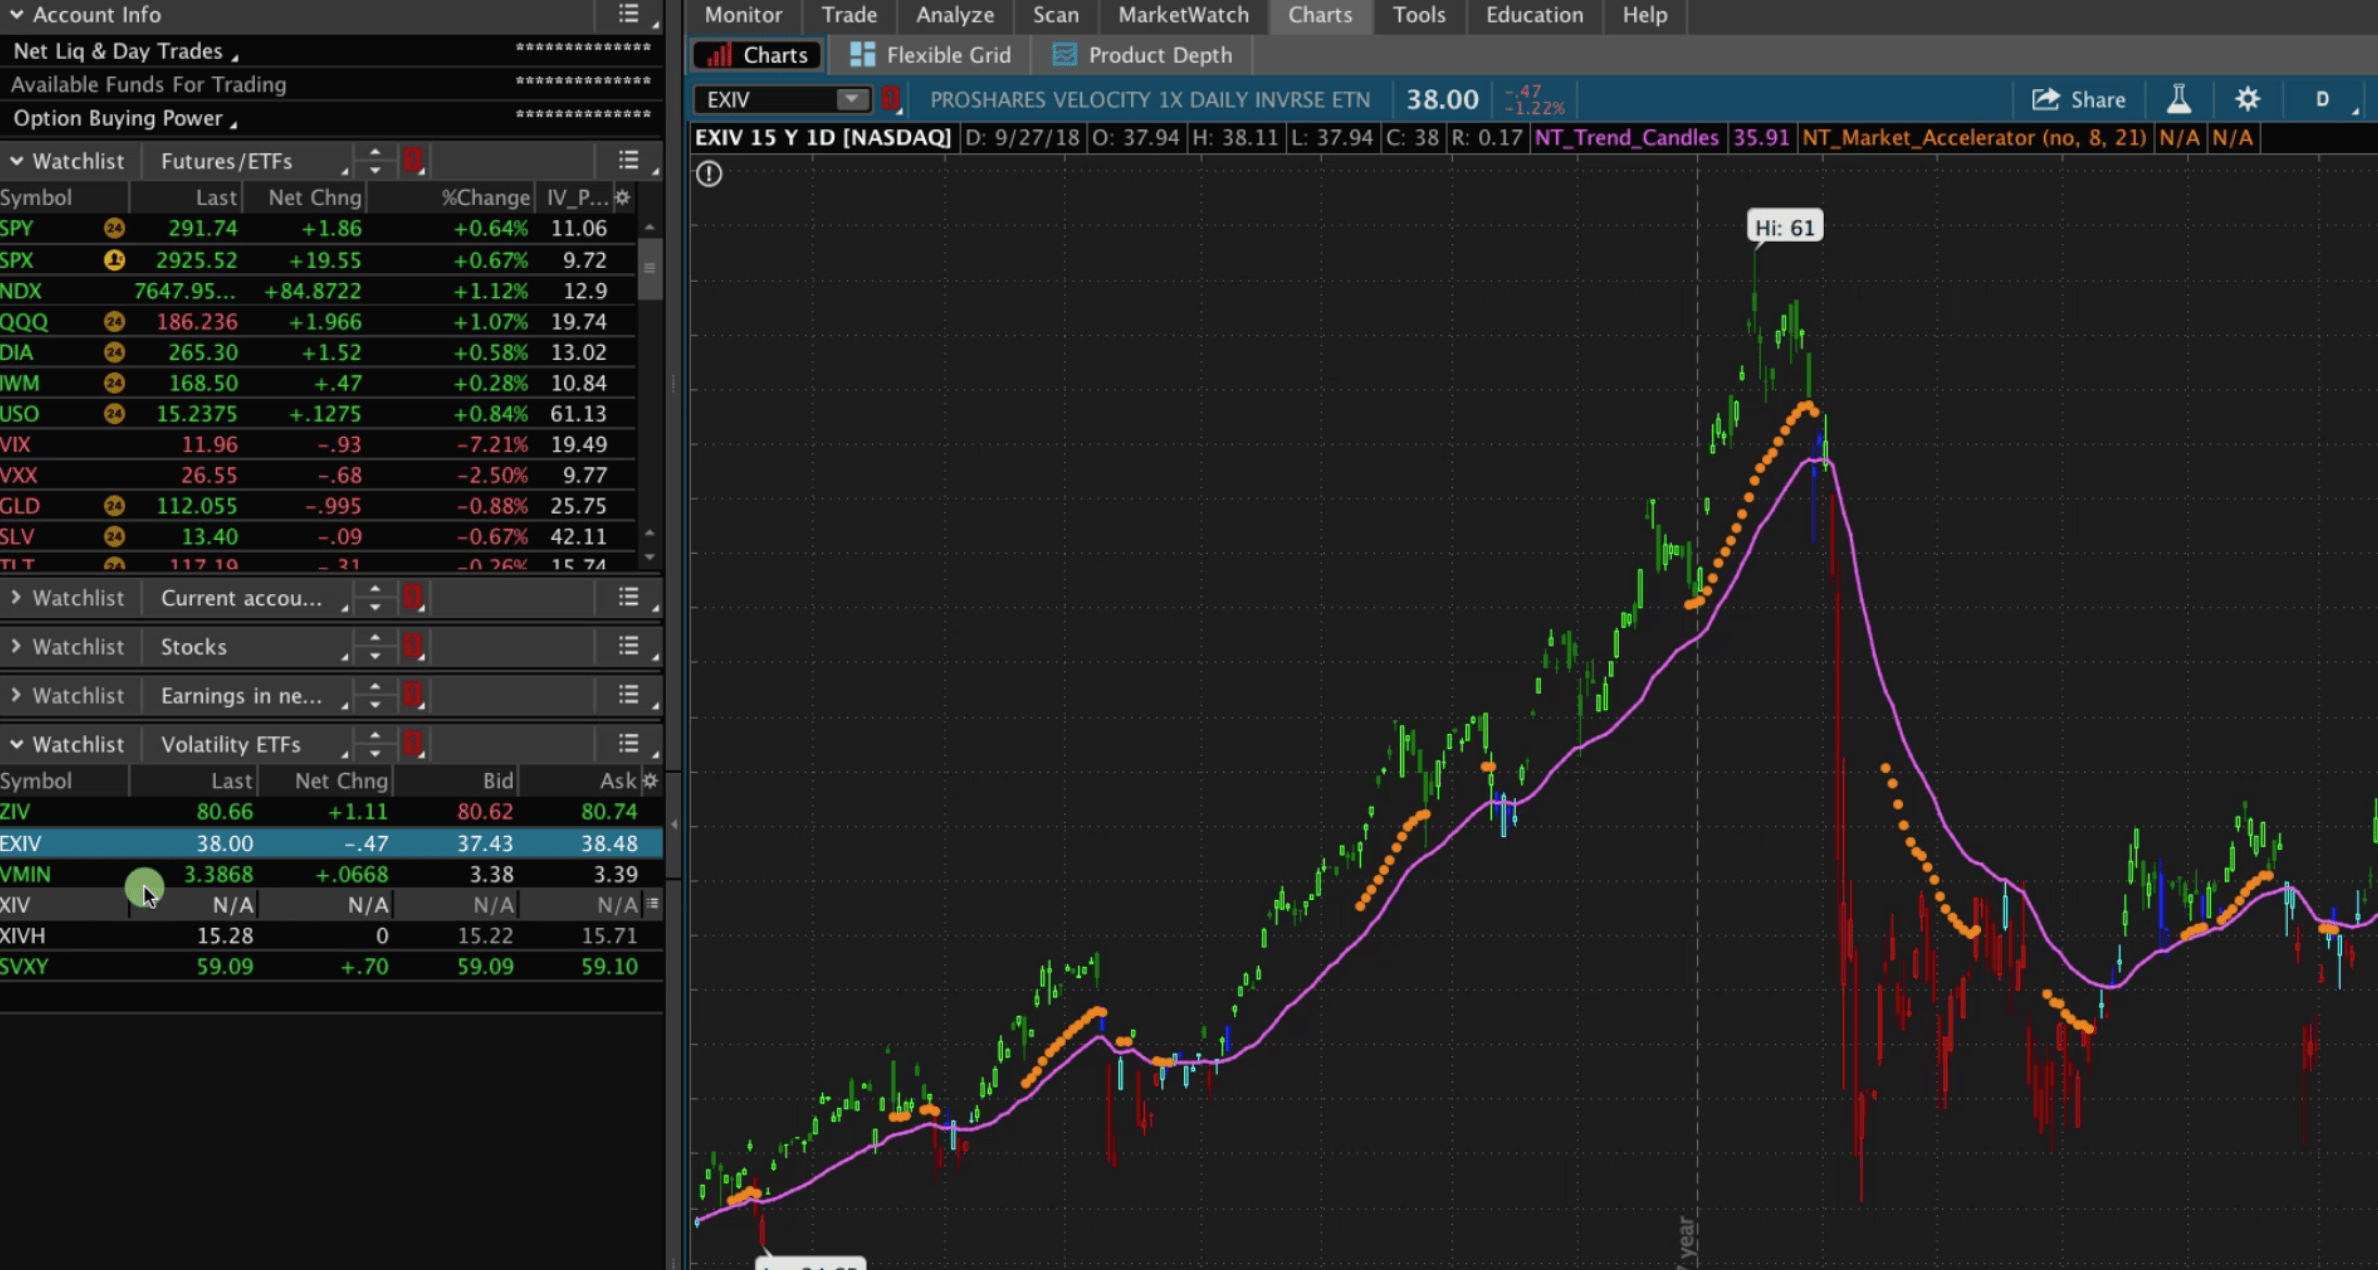

Remember, that’s because this has an inverse correlation or an opposite correlation to the actual VIX. When the market went down, and the VIX exploded, this ETF declined significantly, by over 50%.
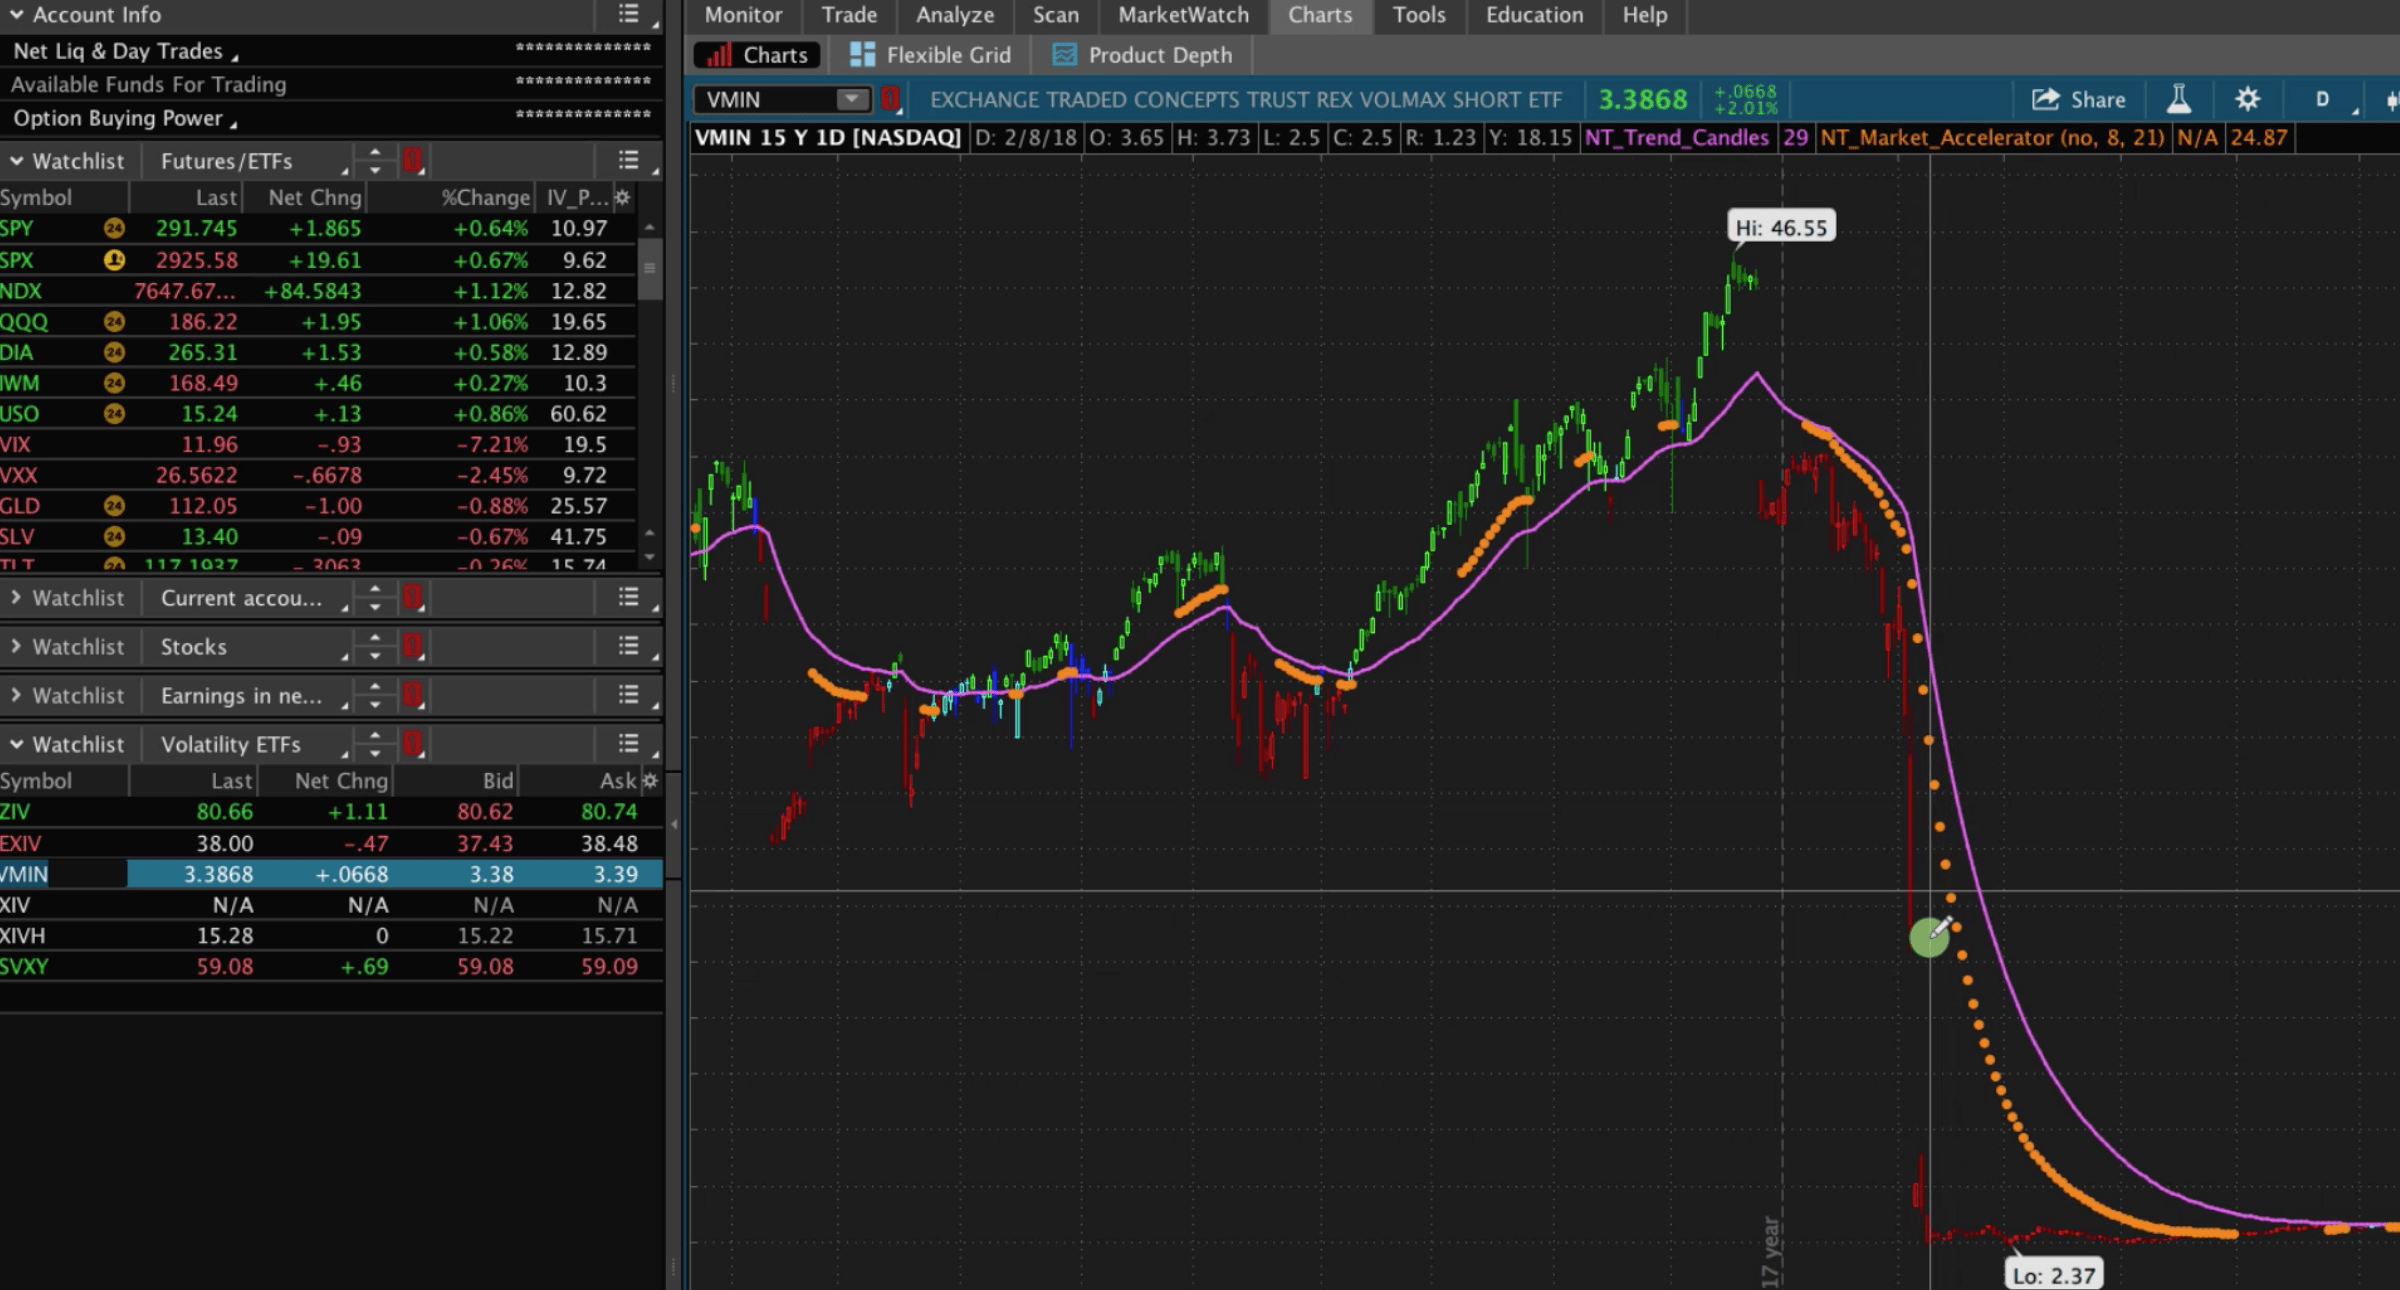
VMIN
Let’s take a look at the next one, VMIN. If we take a look at the chart, what you’ll notice that it had an even more magnificent drop. It peaked at over $46, and then after the little blip in February, you can see that this one is non-existent anymore.

XIV
Same thing with XIV, and this was the one that got the most press, because it had the most dramatic drop. It peaked just over $146 prior to that February drop. Then, it went down to under $6 at one point. Credit Suisse, who’s the manager of this ETN, closed the door and shut it down completely.
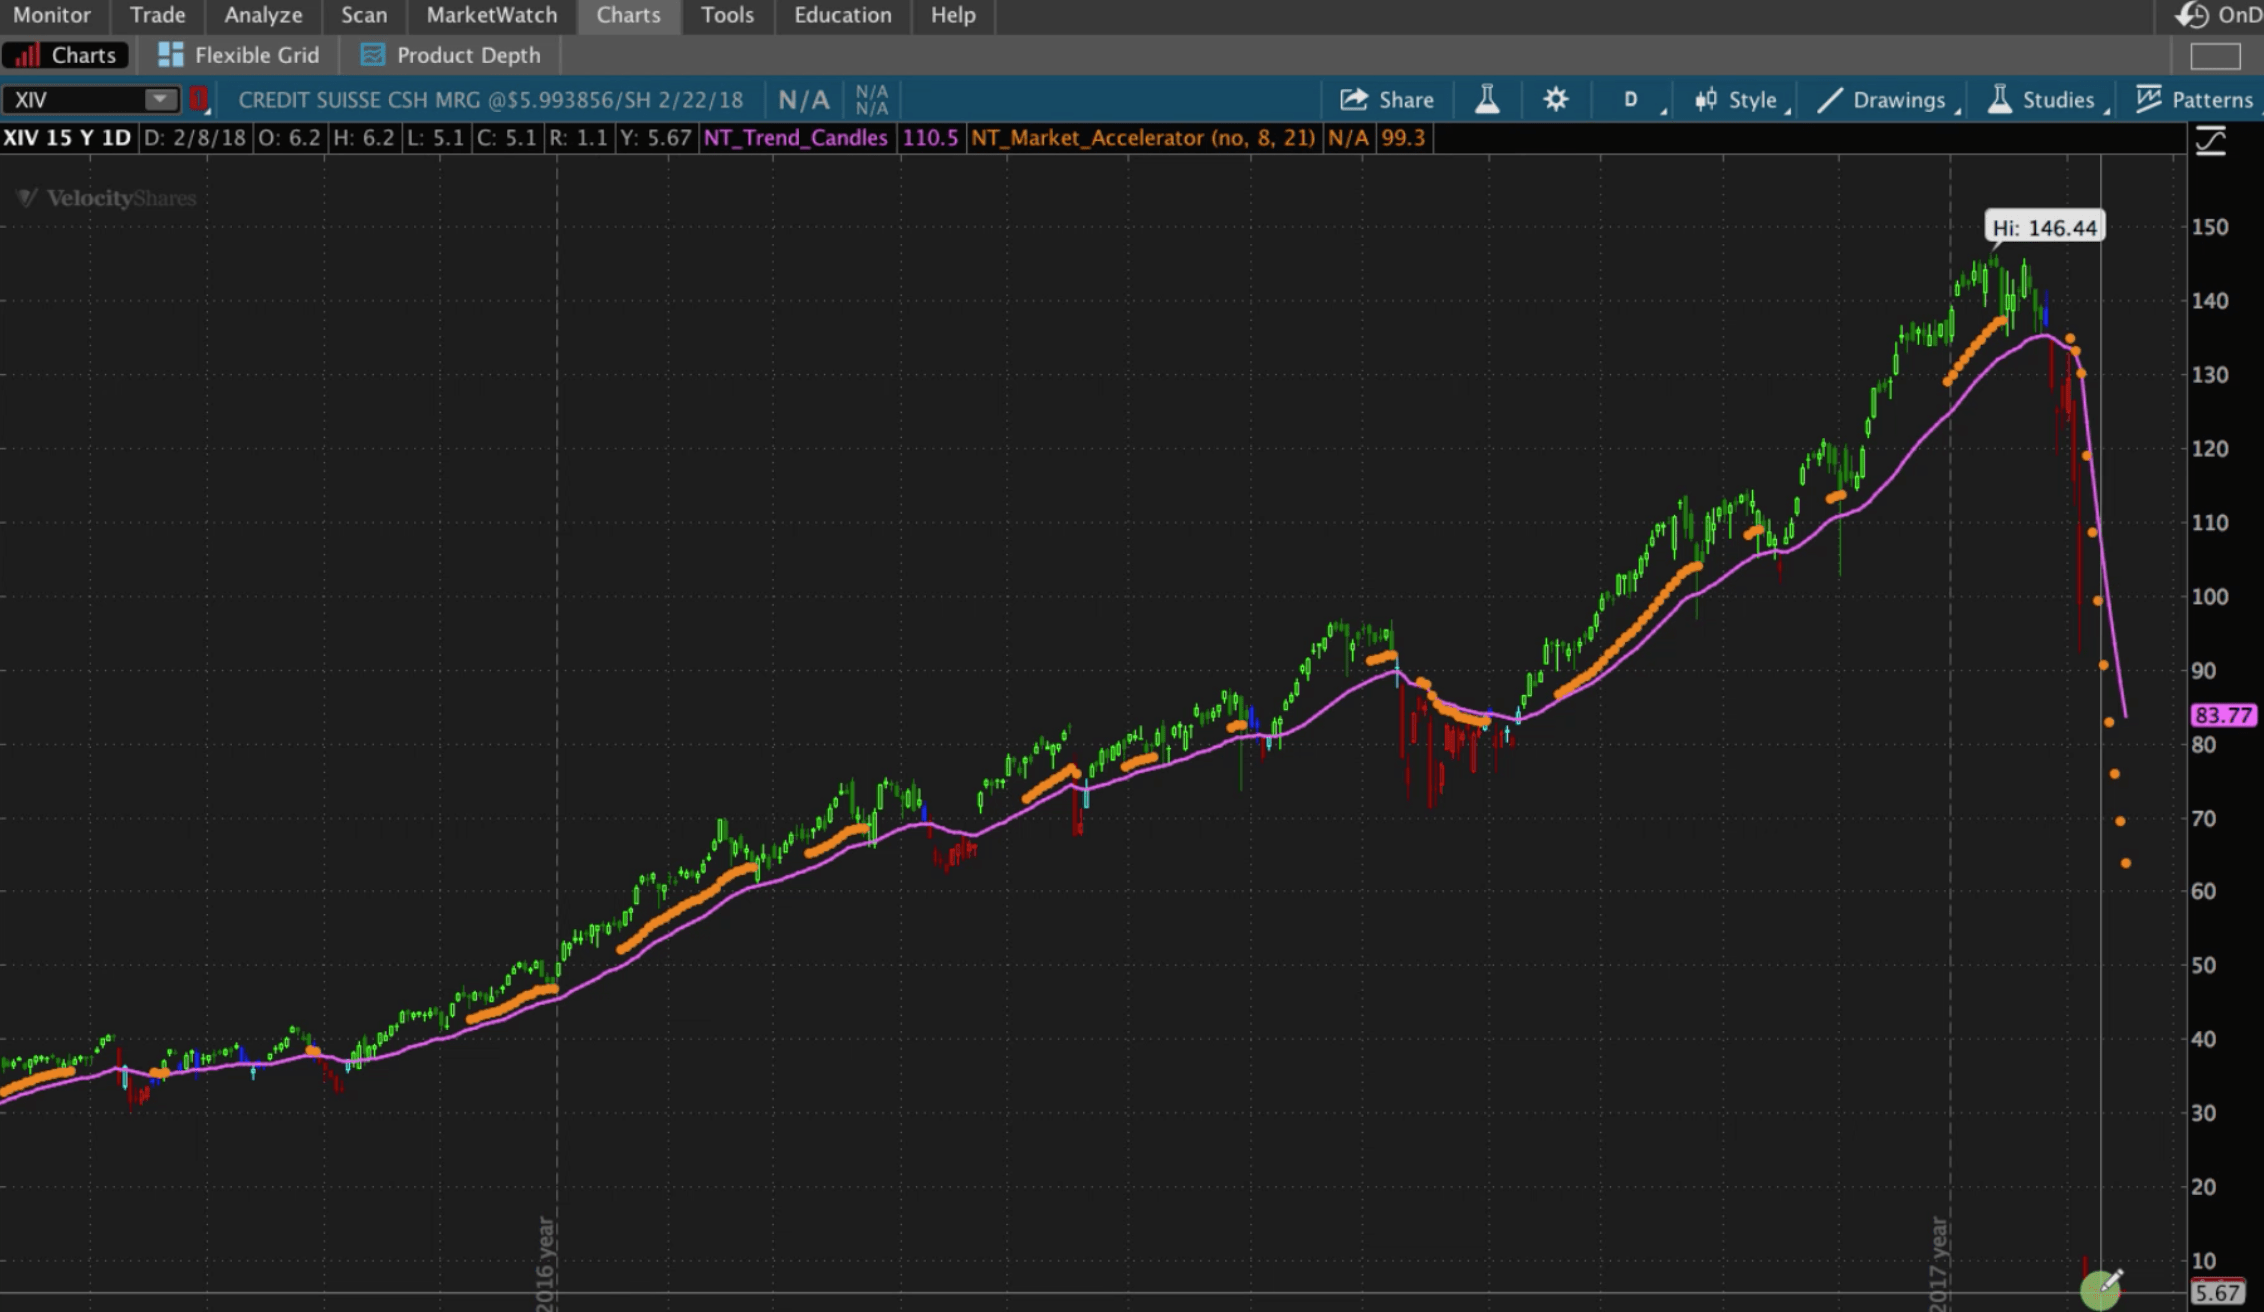

This one actually had substantial liquidity and was heavily traded, but in this case, people who were buying this and just playing that volatility selling game got hurt really bad, and basically lost everything if they owned shares of XIV.
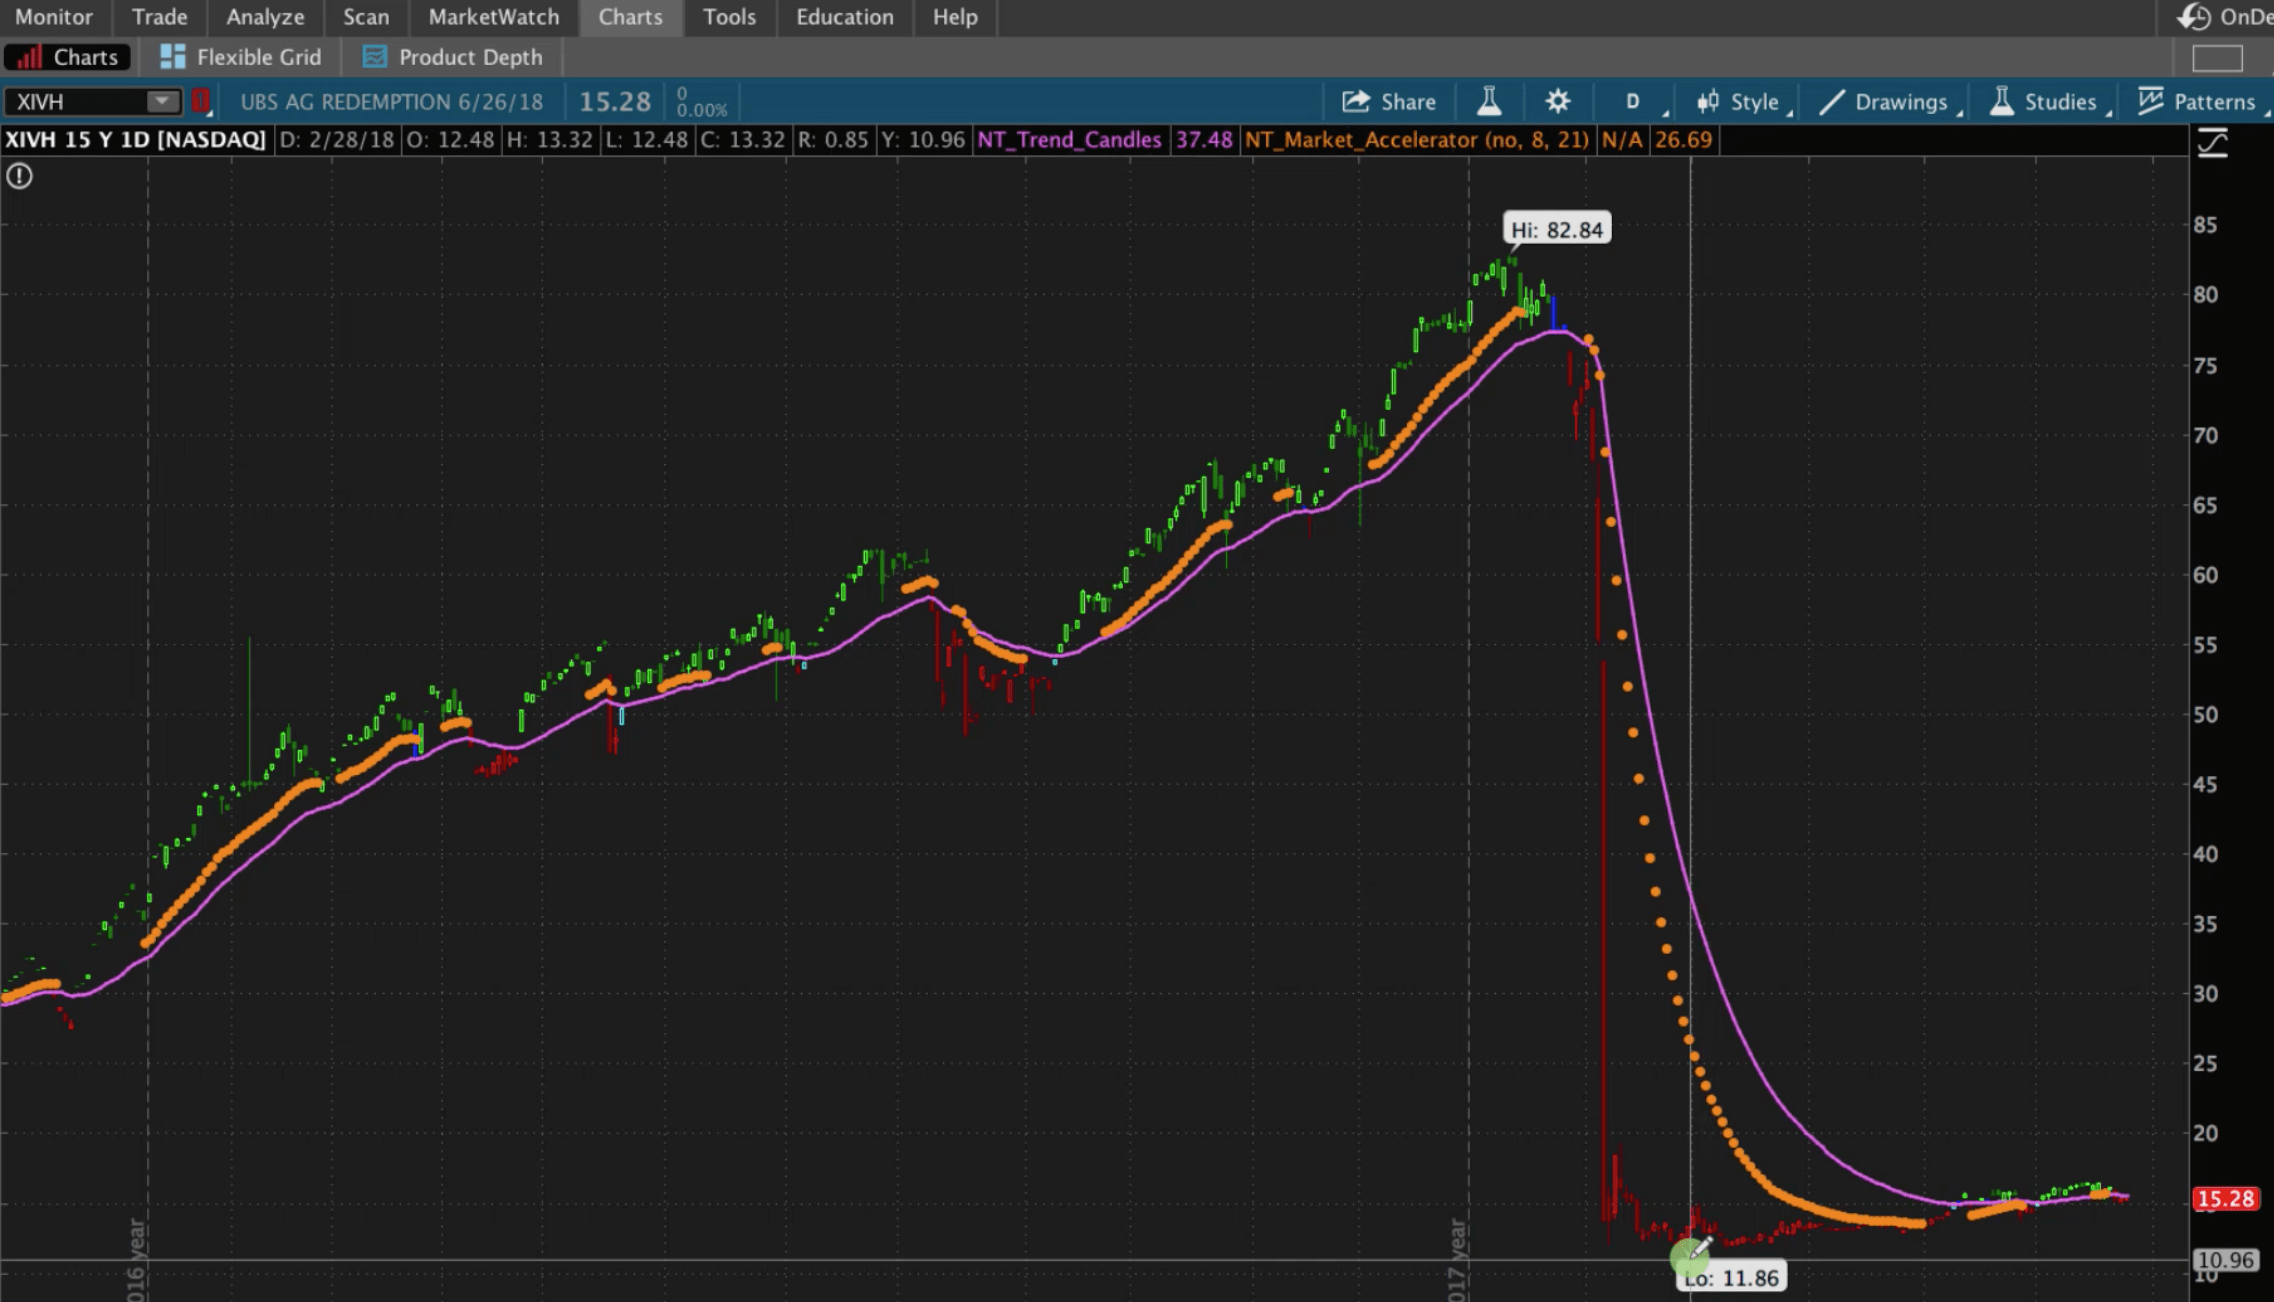
XIVH
And a very similar story with XIVH. In this case, it had a high of $82, and dropped down to a little over $11. It hung around a little bit longer than XIV, but ended up getting shut down in June of 2018.

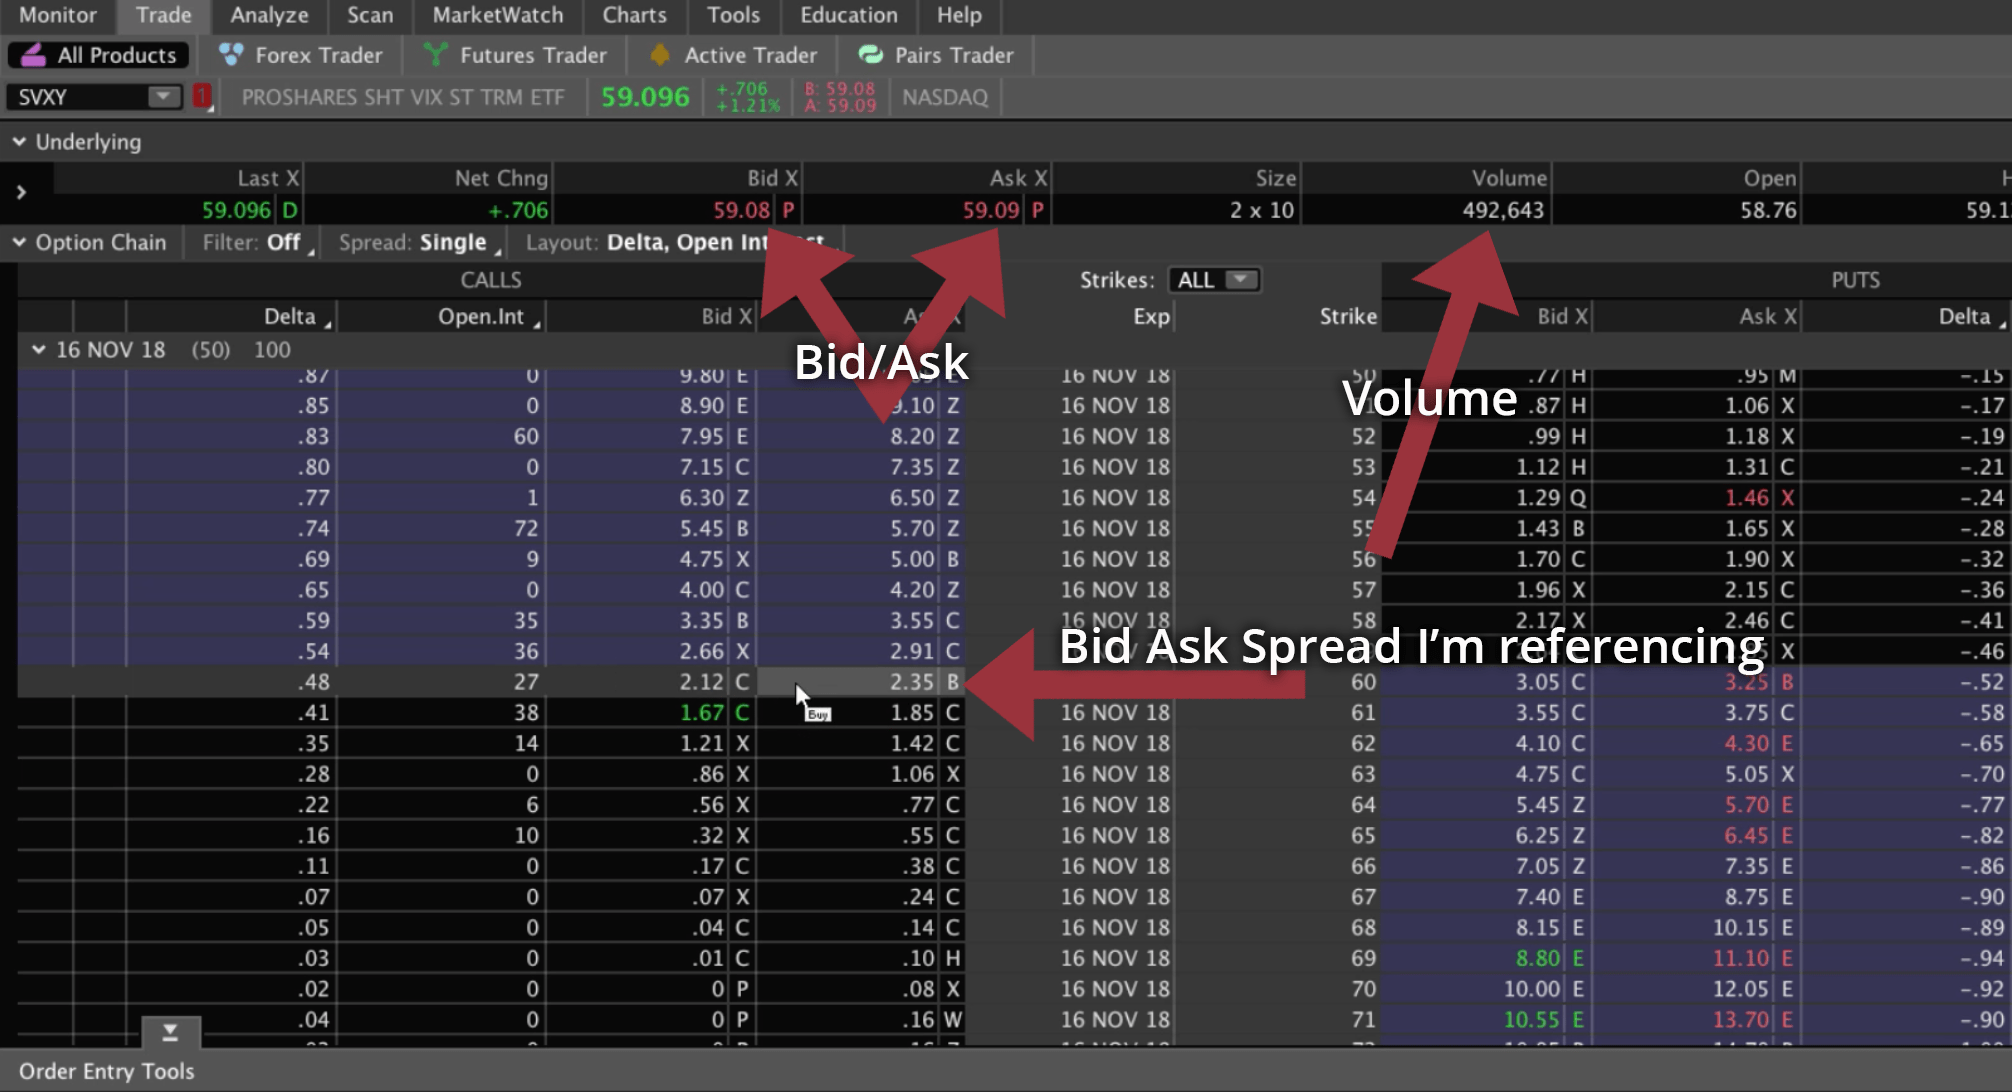
SVXY
SVXY was the most liquid of all these symbols.
If we go to the Trade tab in ThinkorSwim, you can see these are penny-wide bid-ask spreads if you’re buying and selling the underlying symbol.
You’ve got volume that’s not great, but it’s over 490,000 shares traded.
And SVXY actually has somewhat tradable options. These are not options that I would personally trade, because the open interest on these strikes is under 100 contracts.
If you look at the bid-ask spread on the options, you’re looking at 2.12 and 2.35, that’s just a really wide bid-ask spread.

But let’s take a look at what happened to SVXY during that February period.
It was at over $557 and dropped down into the $50s, losing nearly 90% of its value.
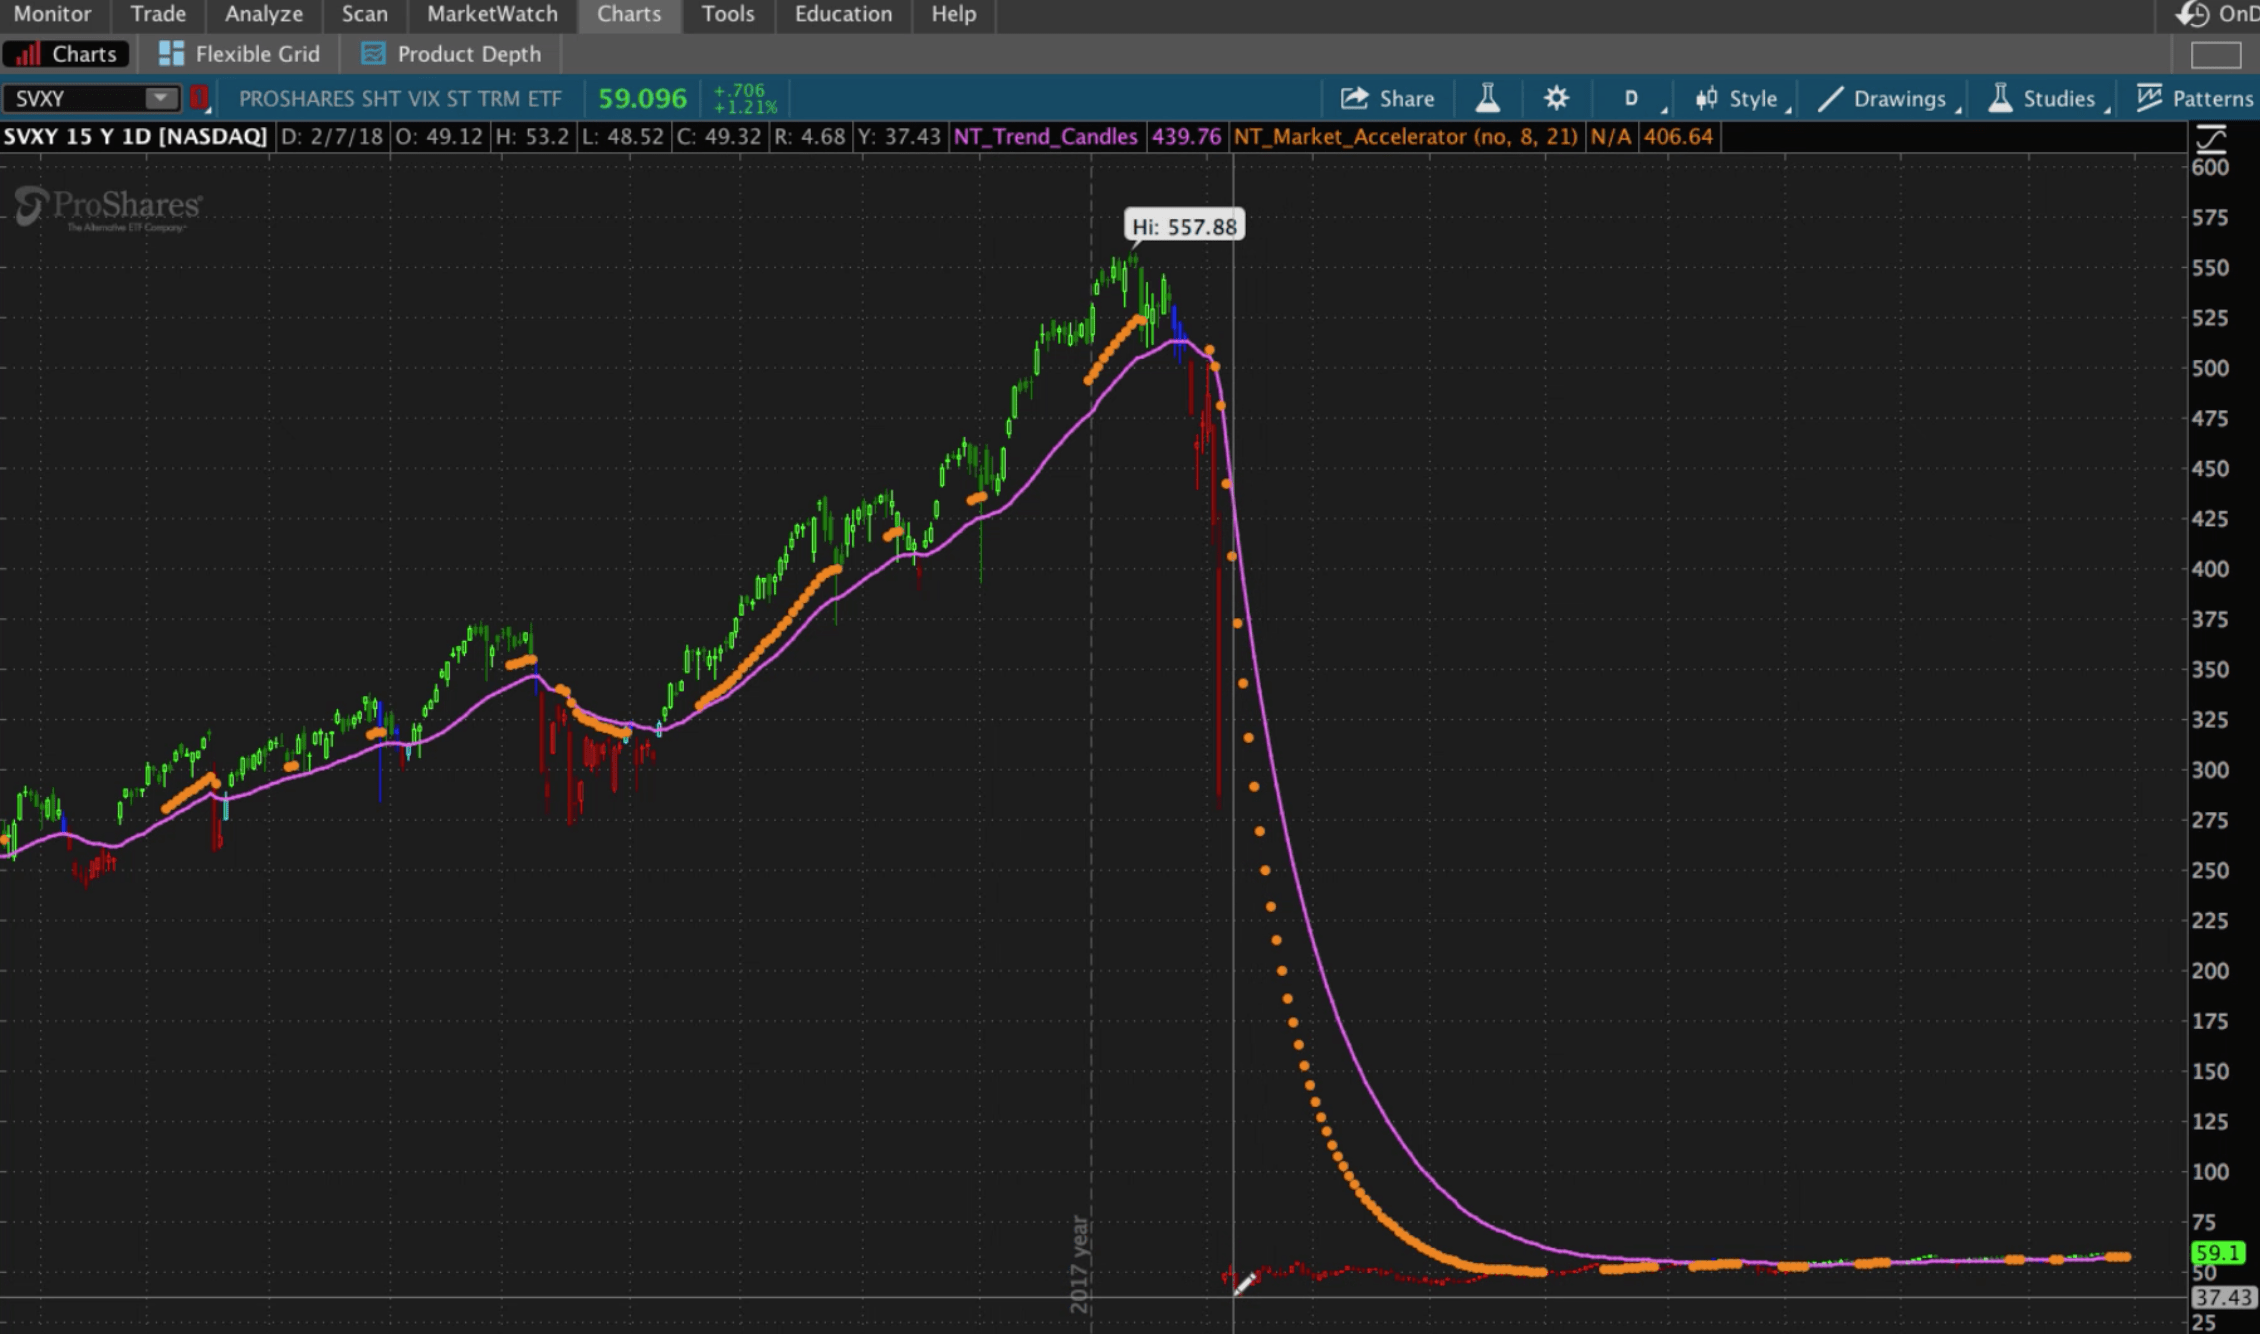

SVXY was not only an inverse, but it was also a leveraged ETF, meaning it was tracking the opposite direction of the VIX, and it was doing it at a 2x level. It was overly leveraged.
Since the February decline in the market, they have changed their calculation and now their inverse exposure is at .5 or half that of the VIX, as opposed to two times that of the VIX.
Concerns
As you were able to see, these are extremely dangerous products to be trading. If for some reason, you still want to dabble in these, and you still want to trade them, here are the main concerns that you want to be aware of:
- Liquidity – You’ve got to have adequate volume and open interest, whether you’re buying and selling the actual shares, or if there are tradable options on those symbols that you’re trading.
- Tradable options – Buying and selling shares is no better than a 50/50 bet. We don’t trade symbols unless they have liquid options with tight bid/ask spreads and ample volume and open interest.
- Financial stability of the issuer – Some of the symbols that we discussed are not necessarily ETFs, but what are called ETNs or Exchange Traded Notes. The difference is an ETF tracks an underlying index, or an ETF; however, an ETN is an Exchange Traded Note that is issued by a financial institution, like Credit Suisse. If you’re investing in an Exchange Traded Note, you want to be comfortable with the issuer of that note, because if they go out of business, then you have exposure, because you’re invested in that note that was issued by that specific bank.
What’s the likelihood of a company like Credit Suisse going out of business? I would say very small. But remember, back in 2008, Lehman Brothers and Bear Stearns were staples on Wall Street, and they no longer exist. Anyone who had Exchange Traded Notes issued by them, had potential exposure and suffered losses that were unrelated to the actual directional price of the underlying symbol.
- Leverage – Lastly, you need to understand leverage. Remember what I said about SVXY, previous to the February decline in the market, they were 2x leveraged of the VIX symbol. After the fact, they changed that to be .5 exposure inversely related to the VIX. If you don’t understand this exposure and you don’t understand the underlying management of these ETFs, or ETNs, you could be exposed to risk that you’re not aware of. Make sure you understand the management and leverage of the underlying symbol that you’re trading.
The Alternative
So, what’s the alternative if you want to have inverse exposure to the VIX?
Here’s a couple of options:
- You could be long SPX or related stocks or ETFs. Remember, the VIX and SPX are inversely correlated. So, if your assumption is that volatility is going to contract, then you must also assume that the S&P 500 or related market stocks or ETFs will be going up. You could simply get long SPX or related stocks and ETFs. You could buy SPY, you could buy Apple, you could buy Amazon, there are dozens, and dozens of stocks and ETFs that are highly correlated to the S&P 500.
- Or, as we detail in our course, “How to Trade the VIX with 92.3% Accuracy”, one of the strategies that we teach, is how to use options to trade short positions on VIX related ETFs.
Both of these solutions are much better alternatives to trading Inverse VIX ETFs.
Remember, as successful traders, we never want to put ourselves in a position of potentially getting knocked out of the game.
Our goal at NavigationTrading is to always continue to hit doubles and singles, and limit your risk exposure so you can continue to trade successfully over the long term.
I hope this lesson has helped you get a better understanding of Inverse VIX ETFs. If you have any questions, you can contact us anytime at info@navigationtrading.com.
Happy trading!
-The NavigationTrading Team

Follow