
Welcome to another lesson from navigationtrading.com. In this lesson, we will discuss the difference between Implied Volatility Rank (IVR) and Implied Volatility Percentile (IV%).
There are a lot of different “indicators” out there, almost all of which are lagging indicators, meaning they simply display what has already happened in the past. Implied Volatility is the only forward looking indication there is.
We have created an indicator called the NavigationTrading IV Indicator, and it’s plotted here on our charts.
Example of NavigationTrading IV Indicator
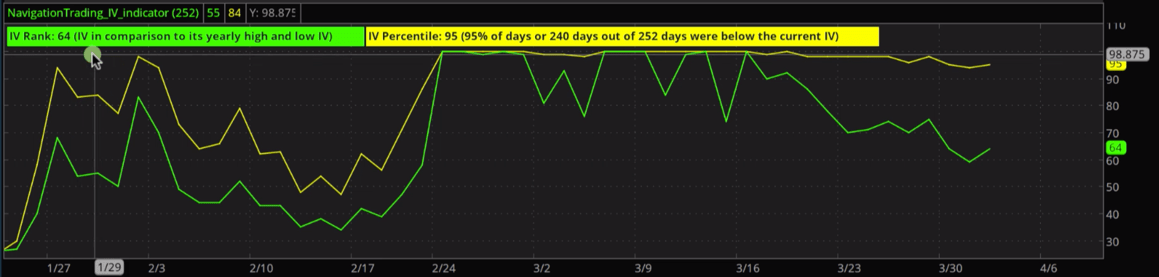

Displayed on the indicator is a brief description of what each line represents.
IV Rank (green line) – Implied Volatility compared to its yearly high and low.
There are some shortfalls with IV Rank, it’s not perfect. This is why we also display IV Percentile
IV Percentile (yellow line) – The percentage of days out of 252 that were below the current IV level
There are about 252 trading days in a year, so it simply calculates the percentage of days that were below the current level over the past year.
As “net sellers” of options, we want to sell options when they are expensive. We consider options expensive when either the IV Rank or IV Percentile are over 50. This simply means, the options are more expensive than they have been over the past year.
Implied Volatility is overstated 85% of the time, meaning the uncertainty, or the fear in the marketplace is overstated. So, if we can sell options when they’re expensive, when implied volatility is high, we are going to benefit when implied volatility contracts.
Example in SPY & NFLX
Let’s look at an example
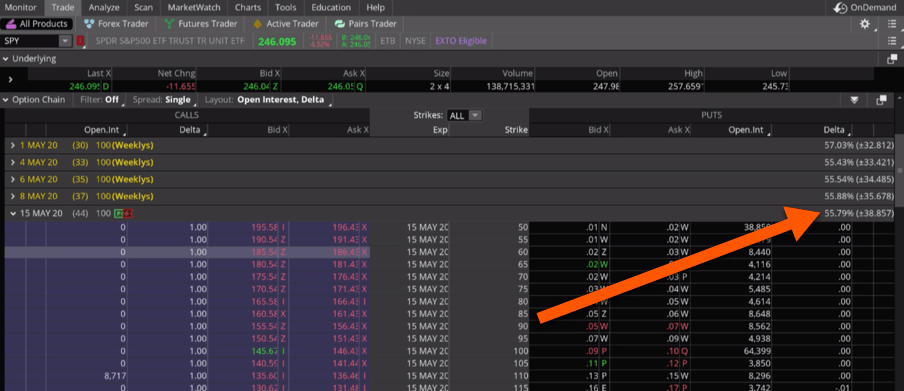
Look at the option chain of SPY. For this example, we will use the May options with 44 days until expiration.
What you’ll notice is that the monthly implied volatility is around 55. How would you know if that is high or low compared to the past? Unless you track and trade that symbol every day…you probably wouldn’t know, right?
IV Trading Example

If we view a stock like Netflix and look at the same cycle, you might say, “Okay, well implied volatility on Netflix is 64. So the implied volatility in Netflix is actually higher than SPY. So wouldn’t we want to sell options in Netflix instead?” Not necessarily.
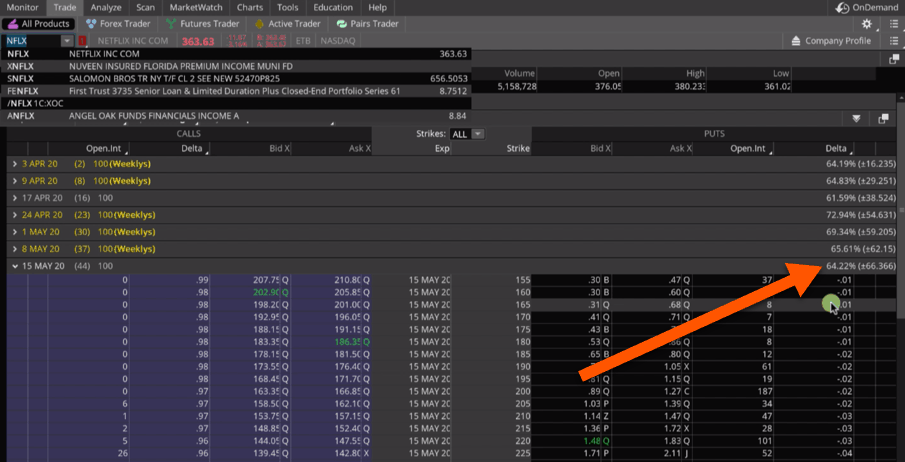

We want to make sure that the implied volatility of those options are high relative to itself. The implied volatility in Netflix is going to be different from the implied volatility in SPY. So if you just look at the option chain, you may not be able to tell if implied volatility is high or low, and that right there is why we use the indicators. So you can see over the last year, specifically in the symbol that you’re looking at, if implied volatility is high or low for that specific symbol.
Expected Range
Lastly, I mentioned that most indicators are lagging indicators. I mean they’re simply plotting a price or they’re plotting something that’s already happened. Here’s why implied volatility is actually a forward looking indicator, or a forward looking projection.
If you go back to the option chain, right next to the monthly implied volatility, you’ll see a number that has a plus or minus sign in front of it.
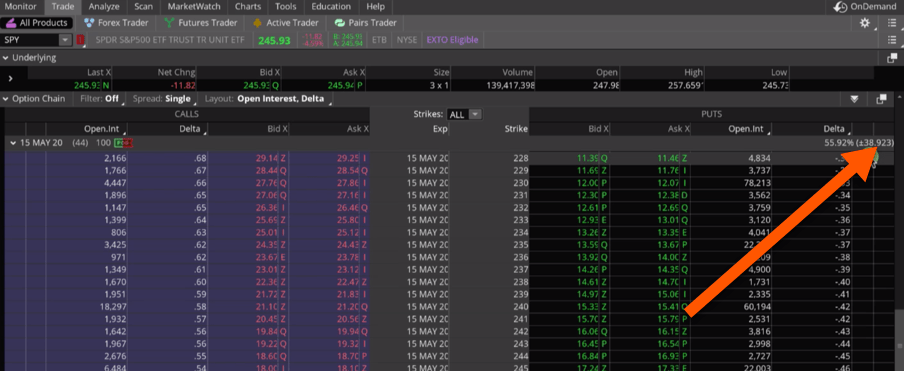

This tells us that over the next 44 days, the expected range of SPY is plus or minus $39. What does that do for us? That gives us an indication of the potential range of SPY over the next 44 days. It’s not something that’s happened in the past, it’s what is expected going forward.
If we review the chart of SPY, the price is currently trading at 245. So the expected low price might be about $206 and the high price might be $284. That’s our expected range over the next 44 days.
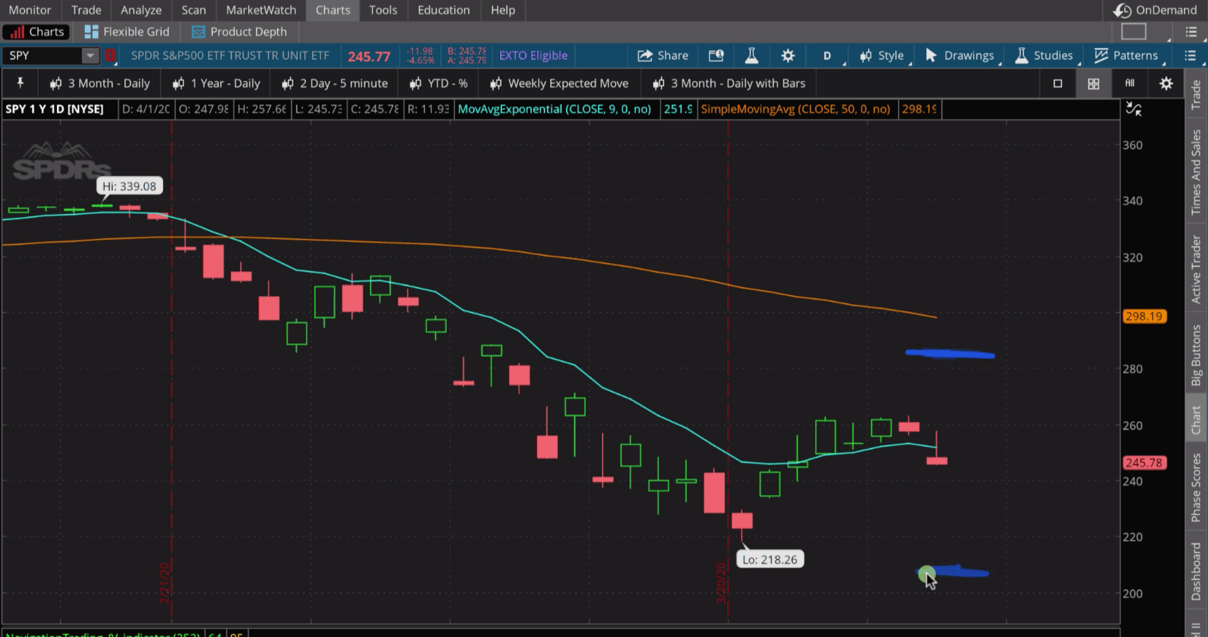

This gives us an indication of where to place our strikes and break-evens for a specific time frame and strategy.
Implied Volatility Rank vs Percentile
Hopefully that gives you a better understanding of implied volatility and more specifically the difference between Implied Volatility Rank and Implied Volatility Percentile.
If you’re interested in putting this indicator on your charts, you can do that for free. Just go to our website, navigationtrading.com. Click on the big orange “Get Started Now” button.
This will take you directly to the page where you can download the indicator for your platform.


Follow