
Hey NavigationTraders!
Welcome to this short tutorial on implied volatility, our “edge” for trading options.
You may have heard the term “implied volatility”, but what does that really mean, and more importantly, how can you use it to your advantage making money trading options?
First, volatility is simply the magnitude of a stock’s price swings. A stock has low volatility if it doesn’t move very much, and it has high volatility if it has big price swings.
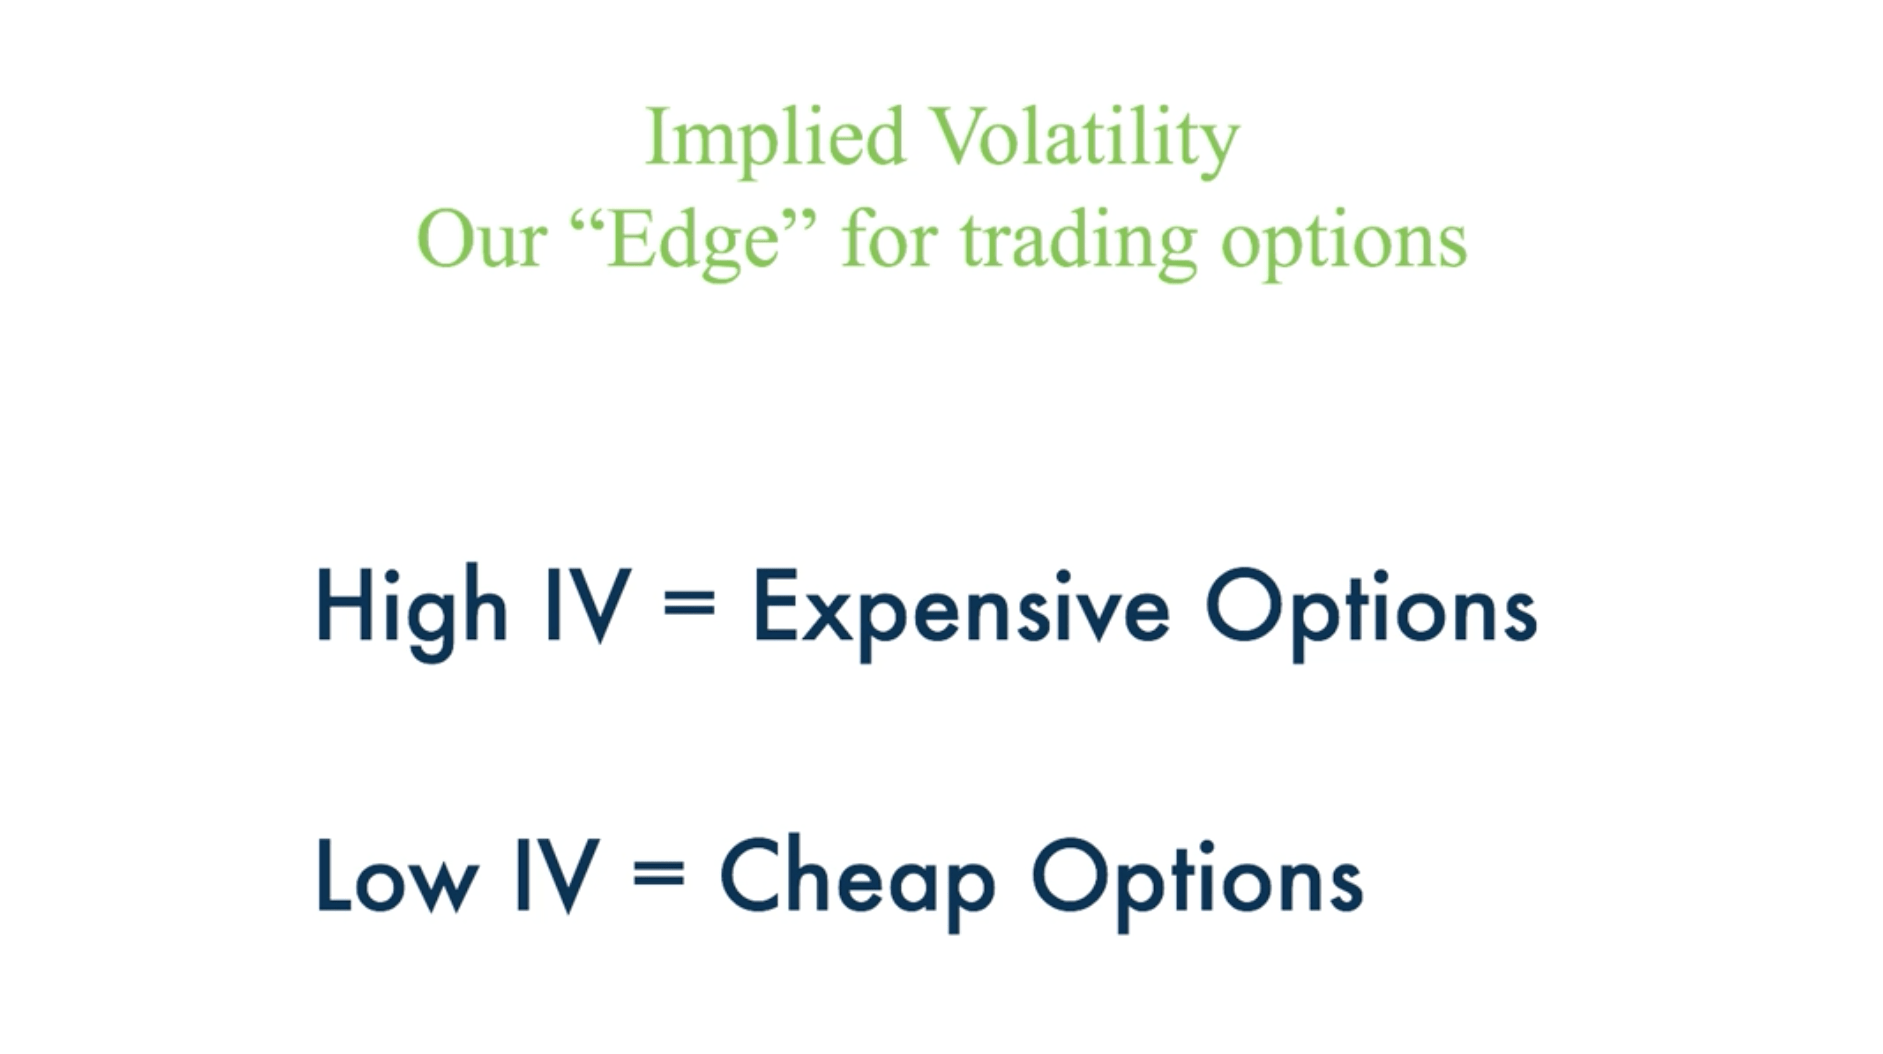
Implied volatility simply gives you a future expected volatility of the underlying symbol that you’re trading. If a stock has high implied volatility, the options on that stock are expensive. If the stock has low implied volatility, the price of the options are cheap.

Before we go to the platform for an example, I want to make a couple more points about implied volatility.
-
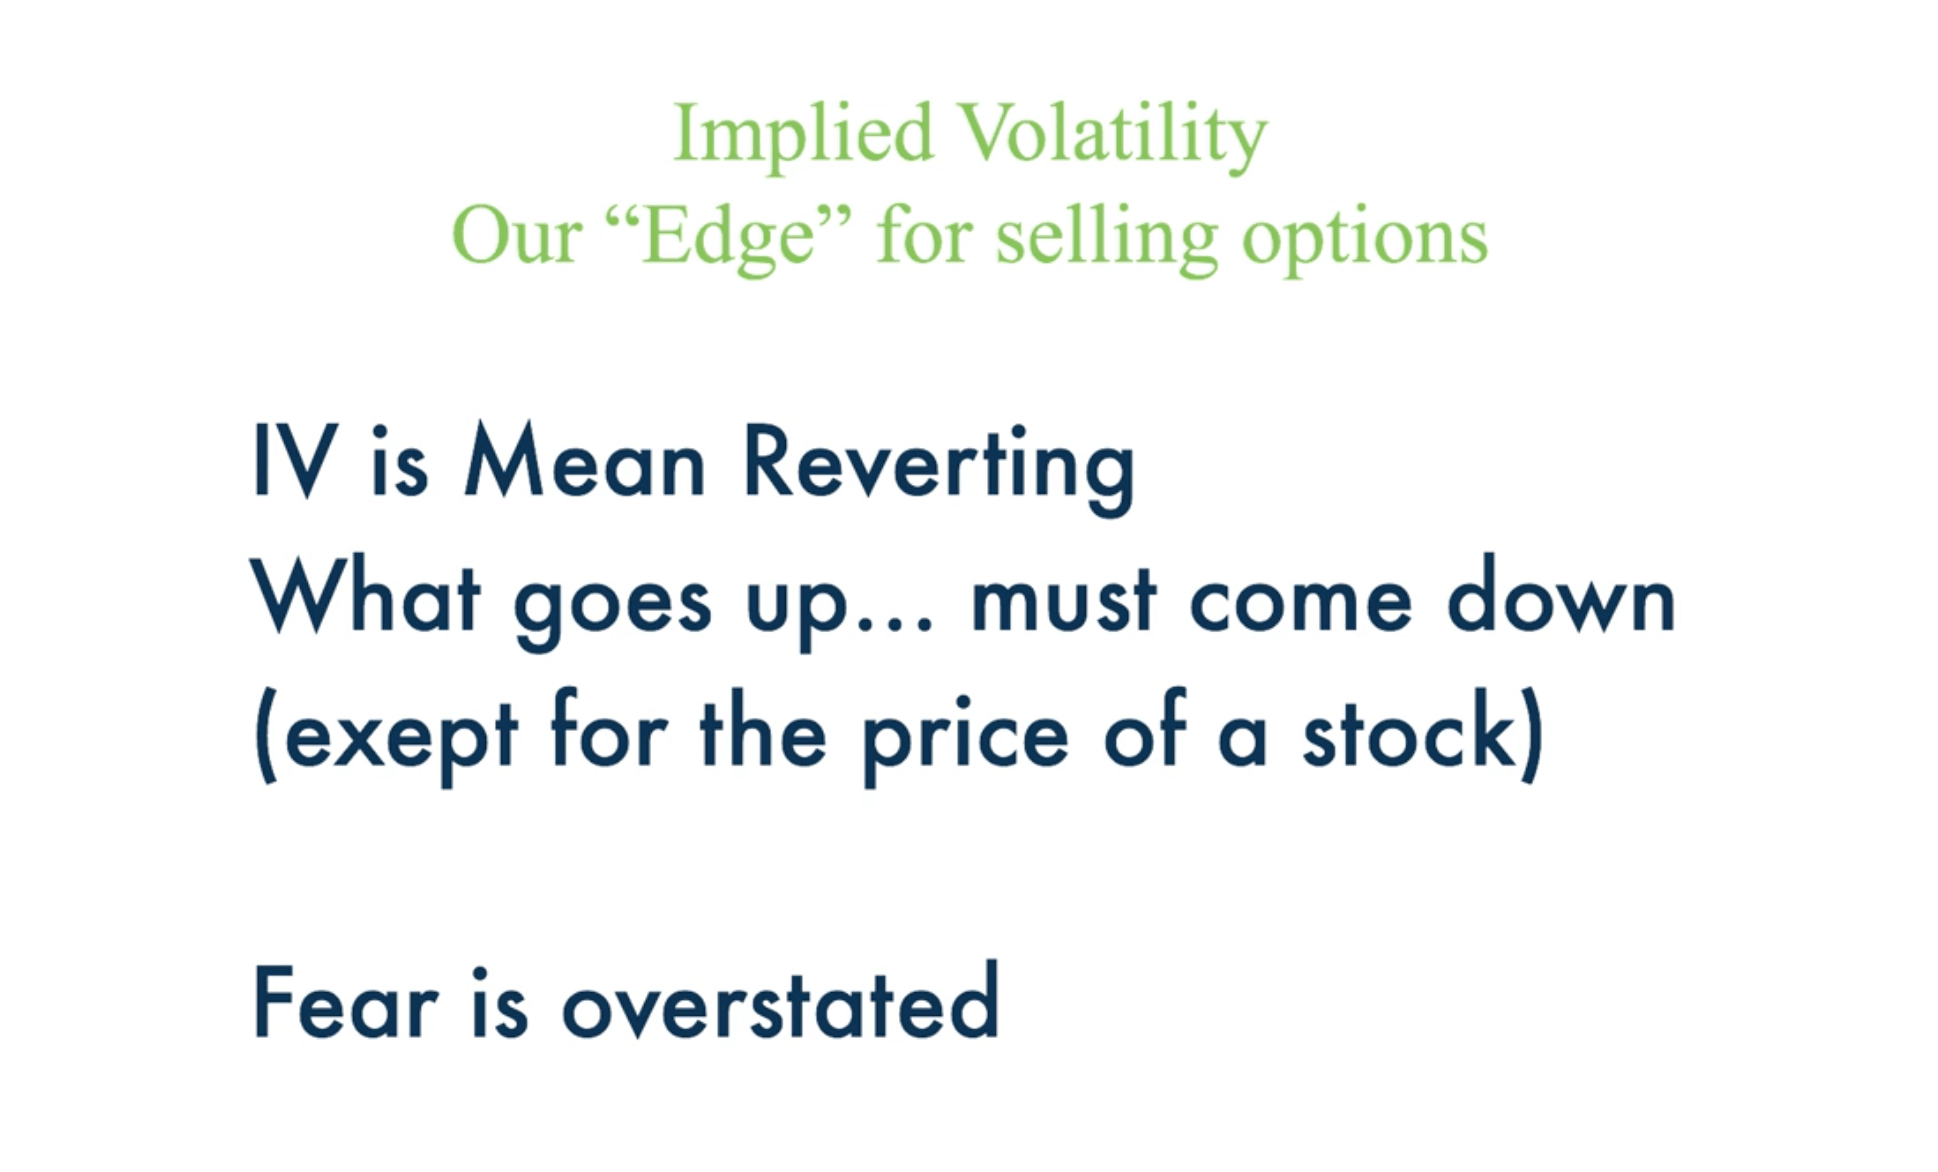
- A key factor to remember about implied volatility is that it’s mean reverting. What goes up must come down. However, the price of a stock is an exception. A stock can continue to go higher, higher, higher, and never revert back to its average, or never revert back to its mean.
- Implied volatility is mean reverting. It goes up. It goes down. It expands and it contracts. It does this due to the fear that comes in and out of the marketplace. If there is fear, or uncertainty, implied volatility goes up. If things are calm and certain, implied volatility goes down.
- The fact is, with trading options (and a lot of other things in life), fear is almost always overstated. When fear or uncertainty comes into the marketplace, implied volatility goes up. The options get more expensive, and this is when we like to place trades to take advantage of that overstated fear of that high implied volatility and sell options when they’re more expensive.

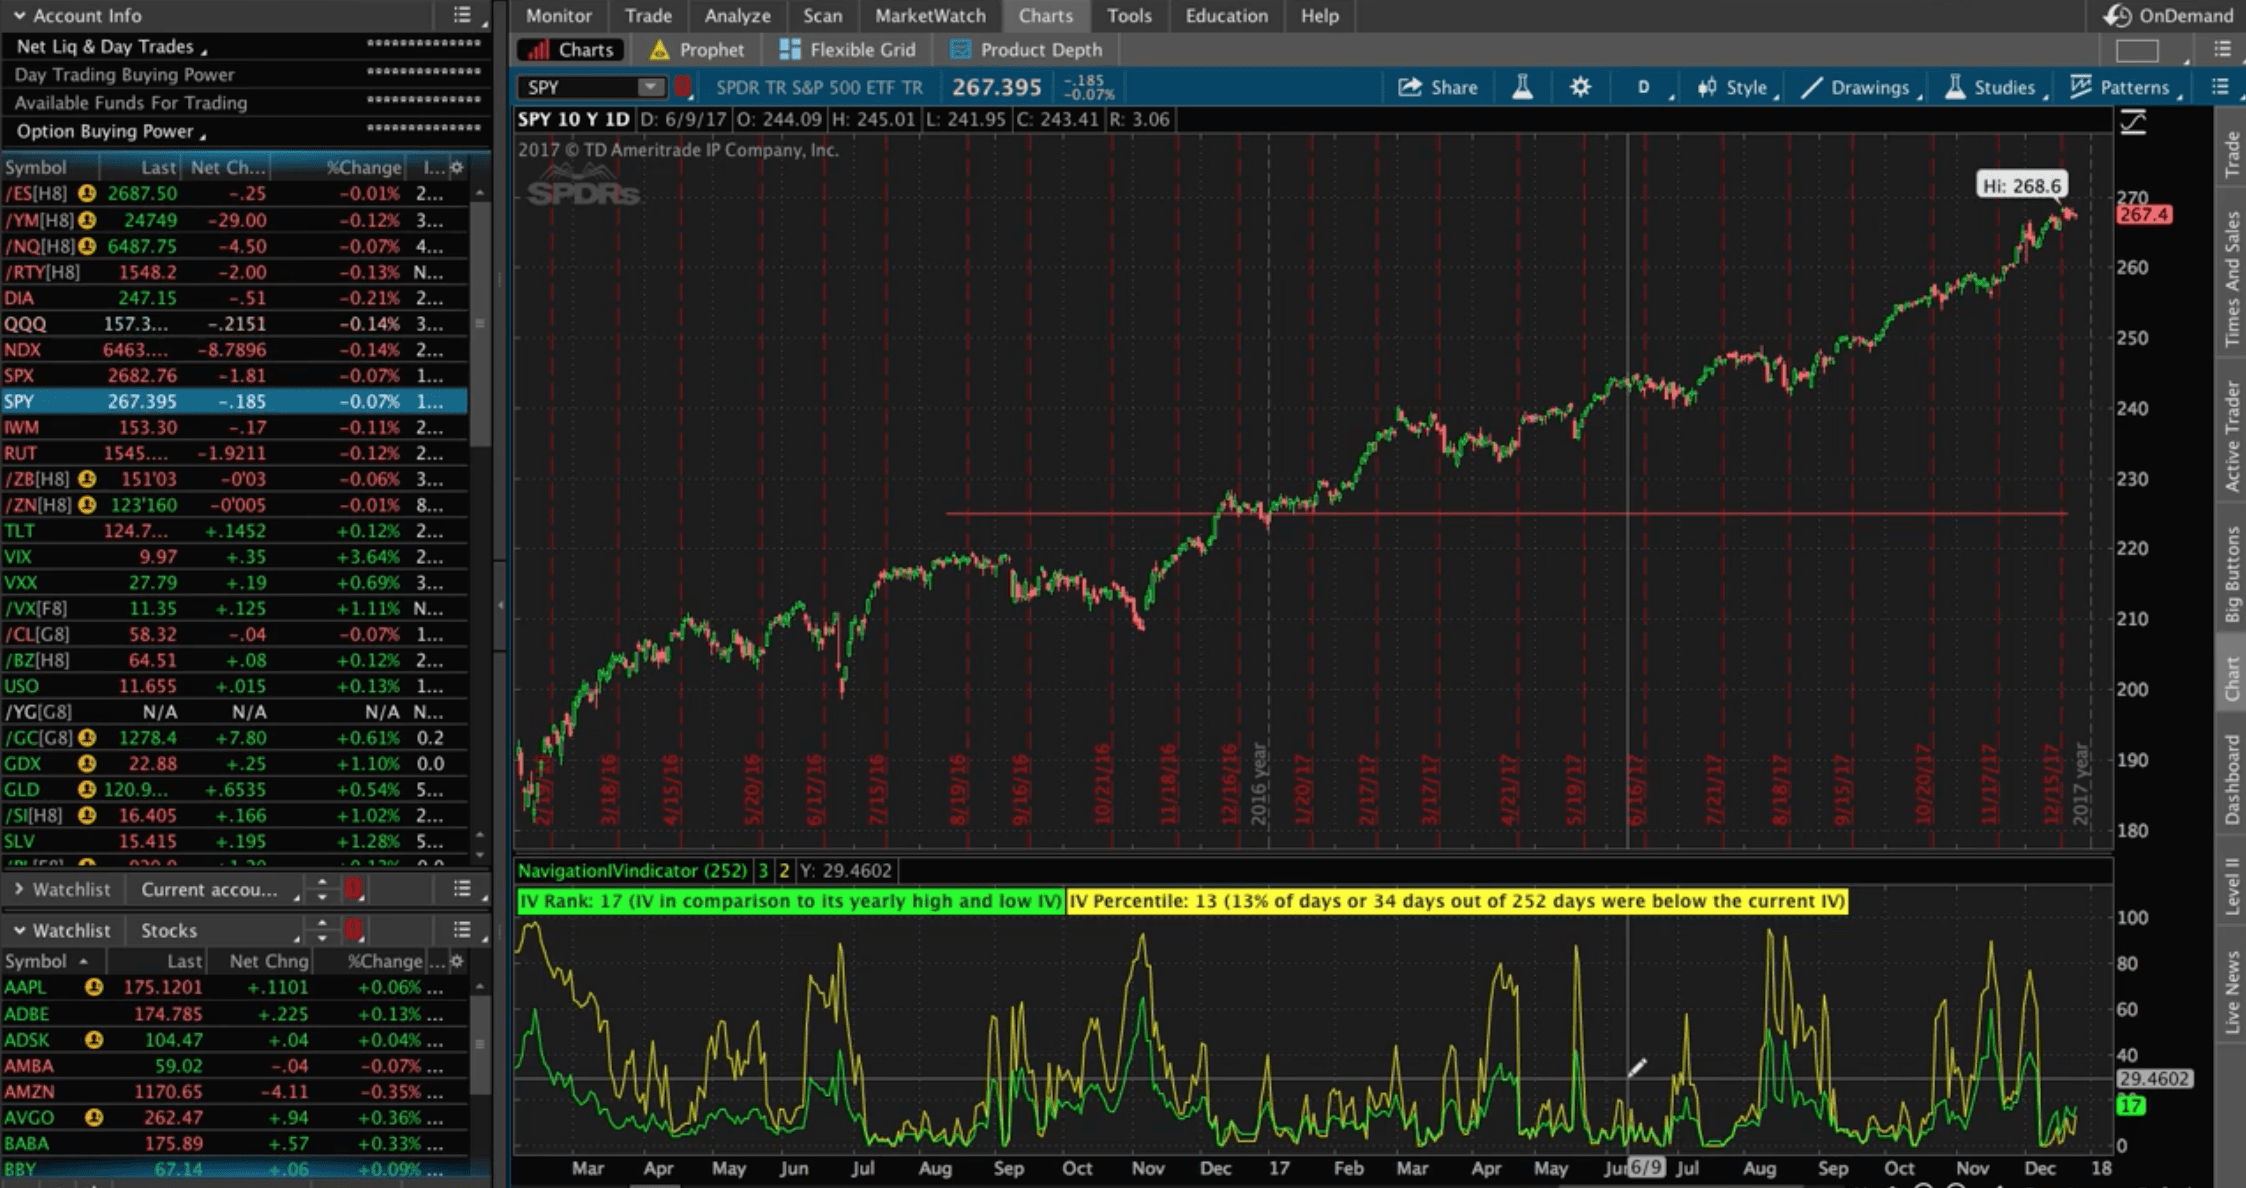
SPY Example
Below is a chart of SPY, which is the S&P 500 ETF.
First, what you’ll notice is that price goes all the way back to February of 2016, and then all the way through the time of this recording, which is December of 2017. As you can see, the price has been very bullish, it’s continued to increase in price over the last couple years, with very little downside and very little pullback.

As I mentioned before, the price of a stock is not mean reverting. It could have a pullback, or it could continue higher
Typically, markets don’t continue in one direction forever. However, the price of a stock or ETF is not considered mean reverting.
Down at the bottom of the platform, I’m using our NavigationTrading Implied Volatility Indicator. This indicator is given to all of our members and we have more in-depth training in our courses about the indicator and how to benefit from its use.
You’ll notice that the implied volatility indicator ranges from 0-100. As I mentioned before, when fear comes into the marketplace, implied volatility goes up, making the options more expensive, and then it contracts back down. It expands and contracts, giving it those mean reverting characteristics.
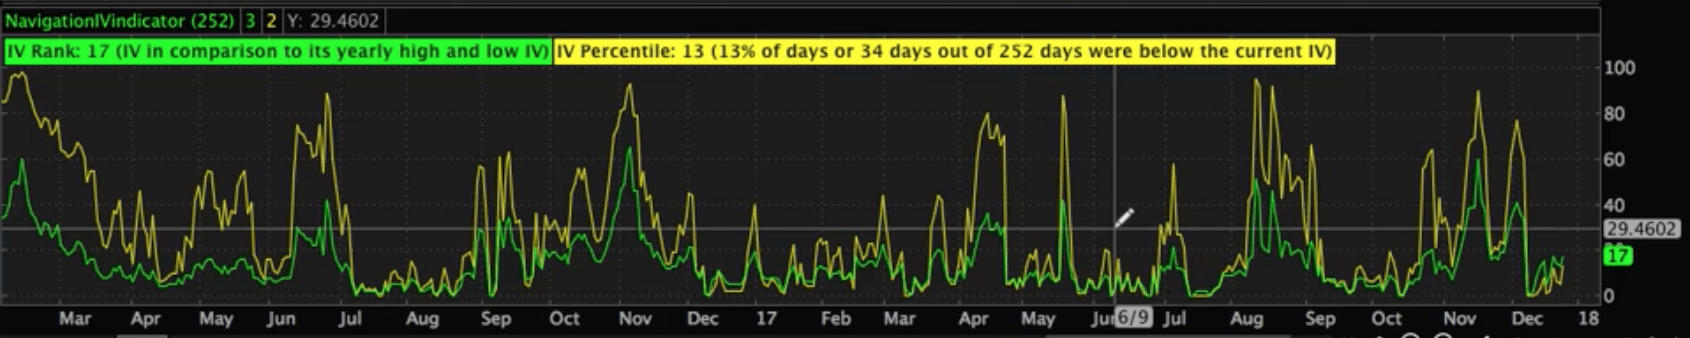

One of the keys to our trading strategy is that we’re selling options, or we’re putting on trades when implied volatility spikes. Then, we’re profiting when the implied volatility contracts. Implied volatility is a key component of trading options. By understanding how it works, we give ourselves a huge edge for making consistent profits.
I hope this lesson on implied volatility was helpful!
Happy trading!
-The NavigationTrading Team

Follow