
Hey NavigationTraders!
Welcome to another lesson with NavigationTrading!
In this blog post I want to show you how to trade a Long Put Vertical in tastyworks.
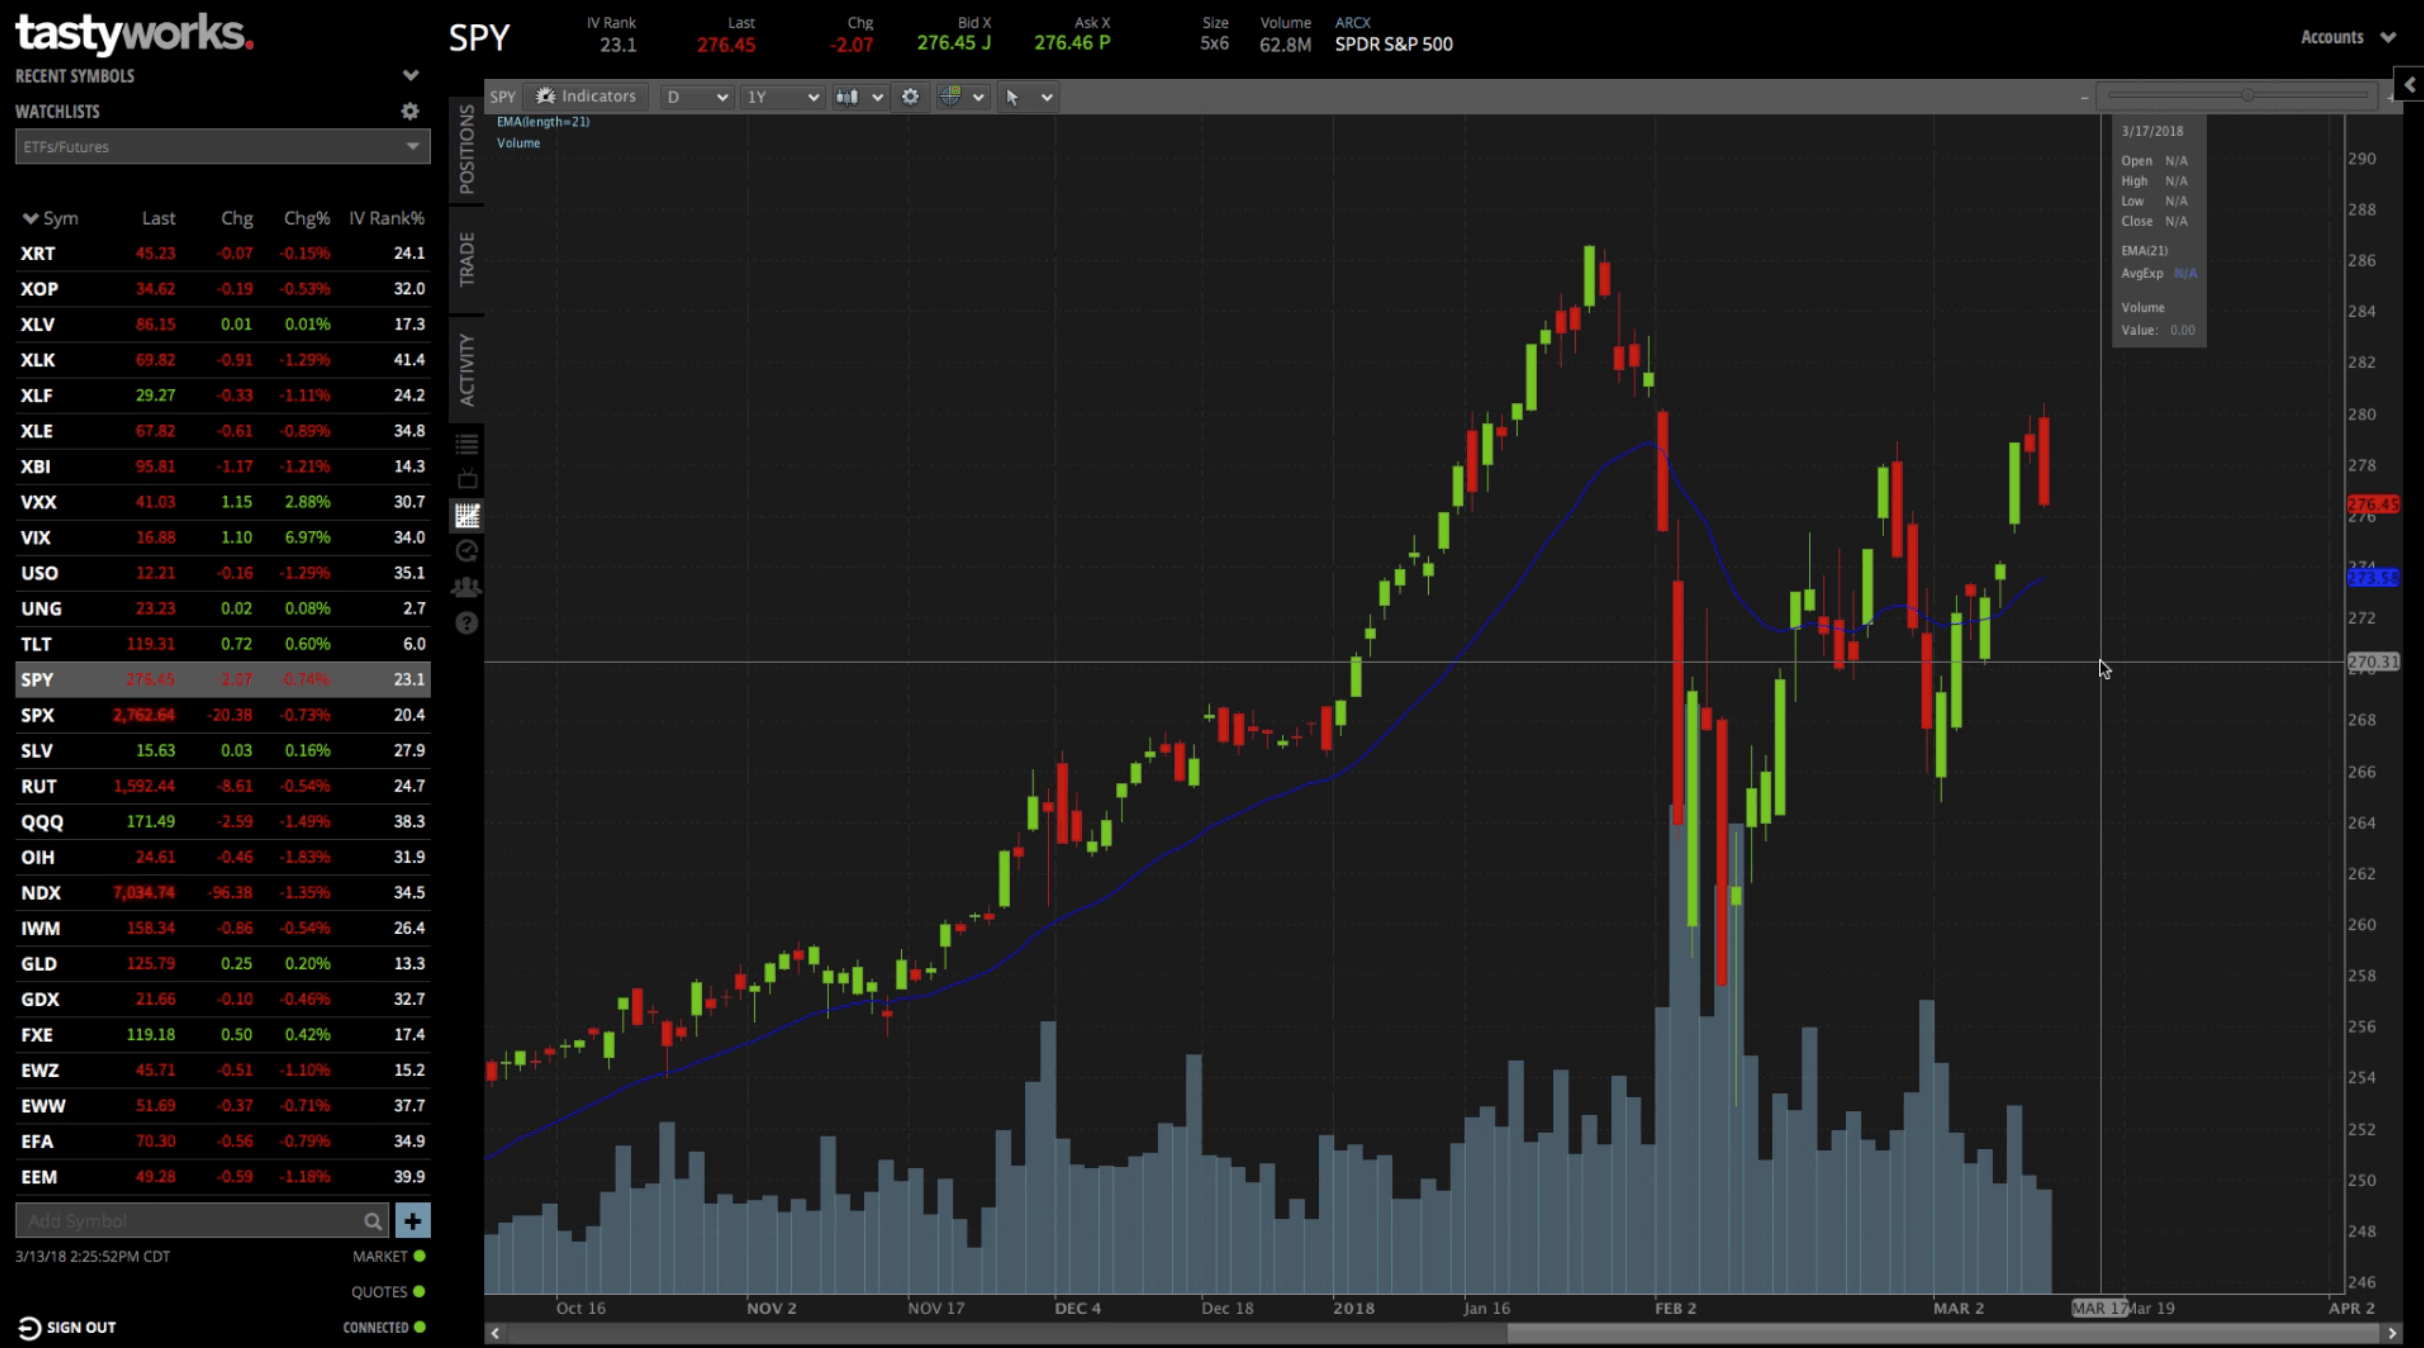
We’re looking at SPY, the S&P 500 ETF.
Let’s say that your assumption was that you wanted to take a bearish position in SPY. You thought in the short-term that SPY was going to go down. One of the positions you could use to do that would be a Long Put Vertical.

Setting Up Your Position
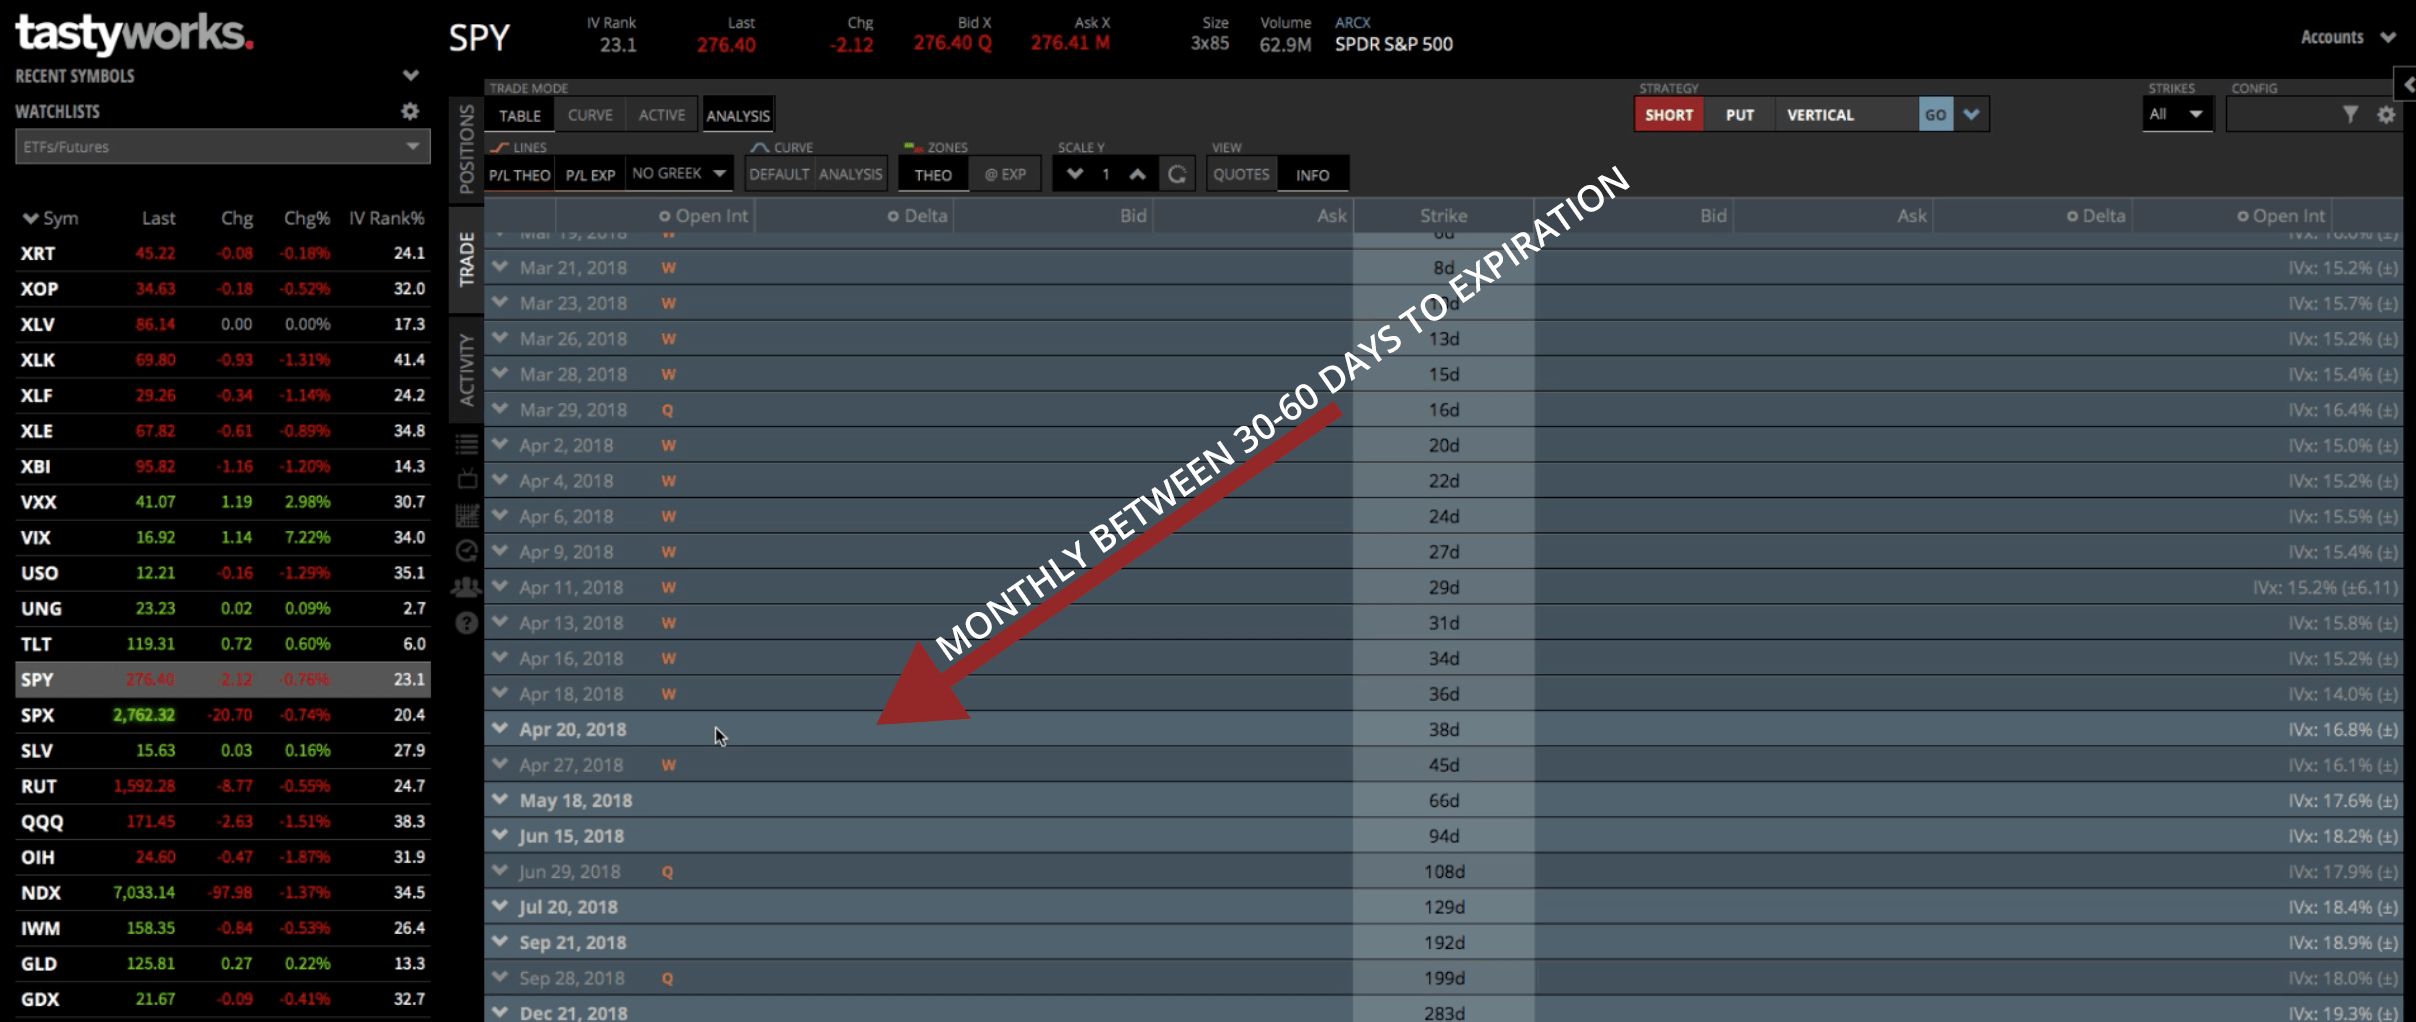
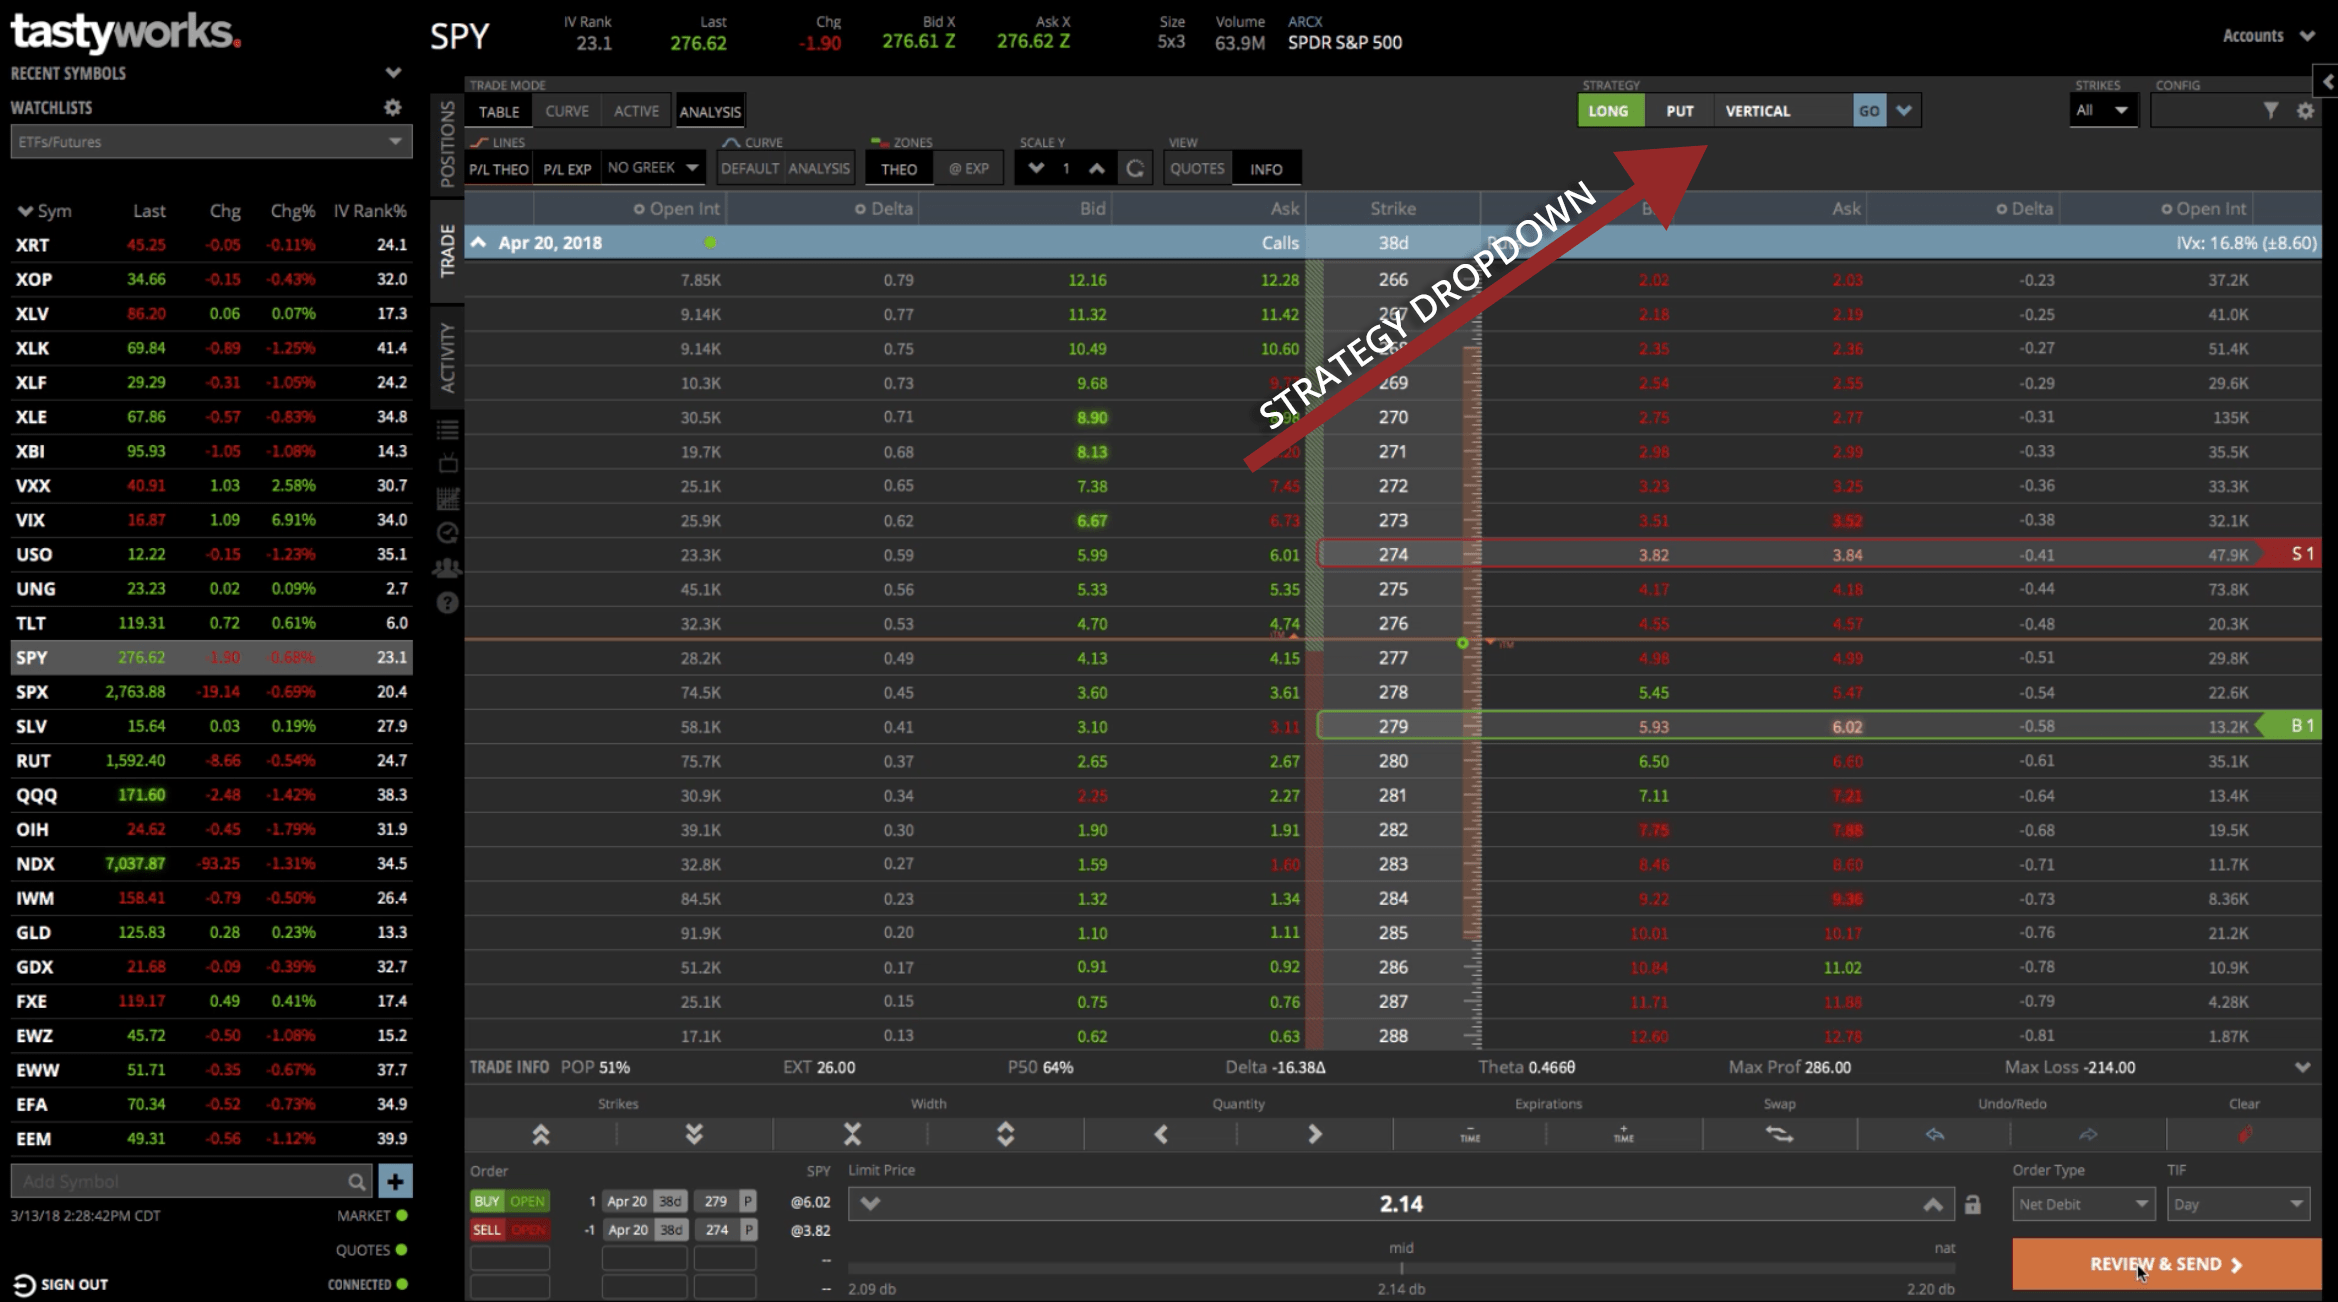
Setting up a Long Put Vertical Spread in tastyworks is easy! Just go to the “Trade” tab. If you’re in the “Table” mode, this will display the different options chains.
We like to stay in the monthlies between 30-60 days to expiration. The bolded white options chains indicate the monthly options. We’ll choose the monthly options chain between 30-60 days to expiration, in this case, 38 days.

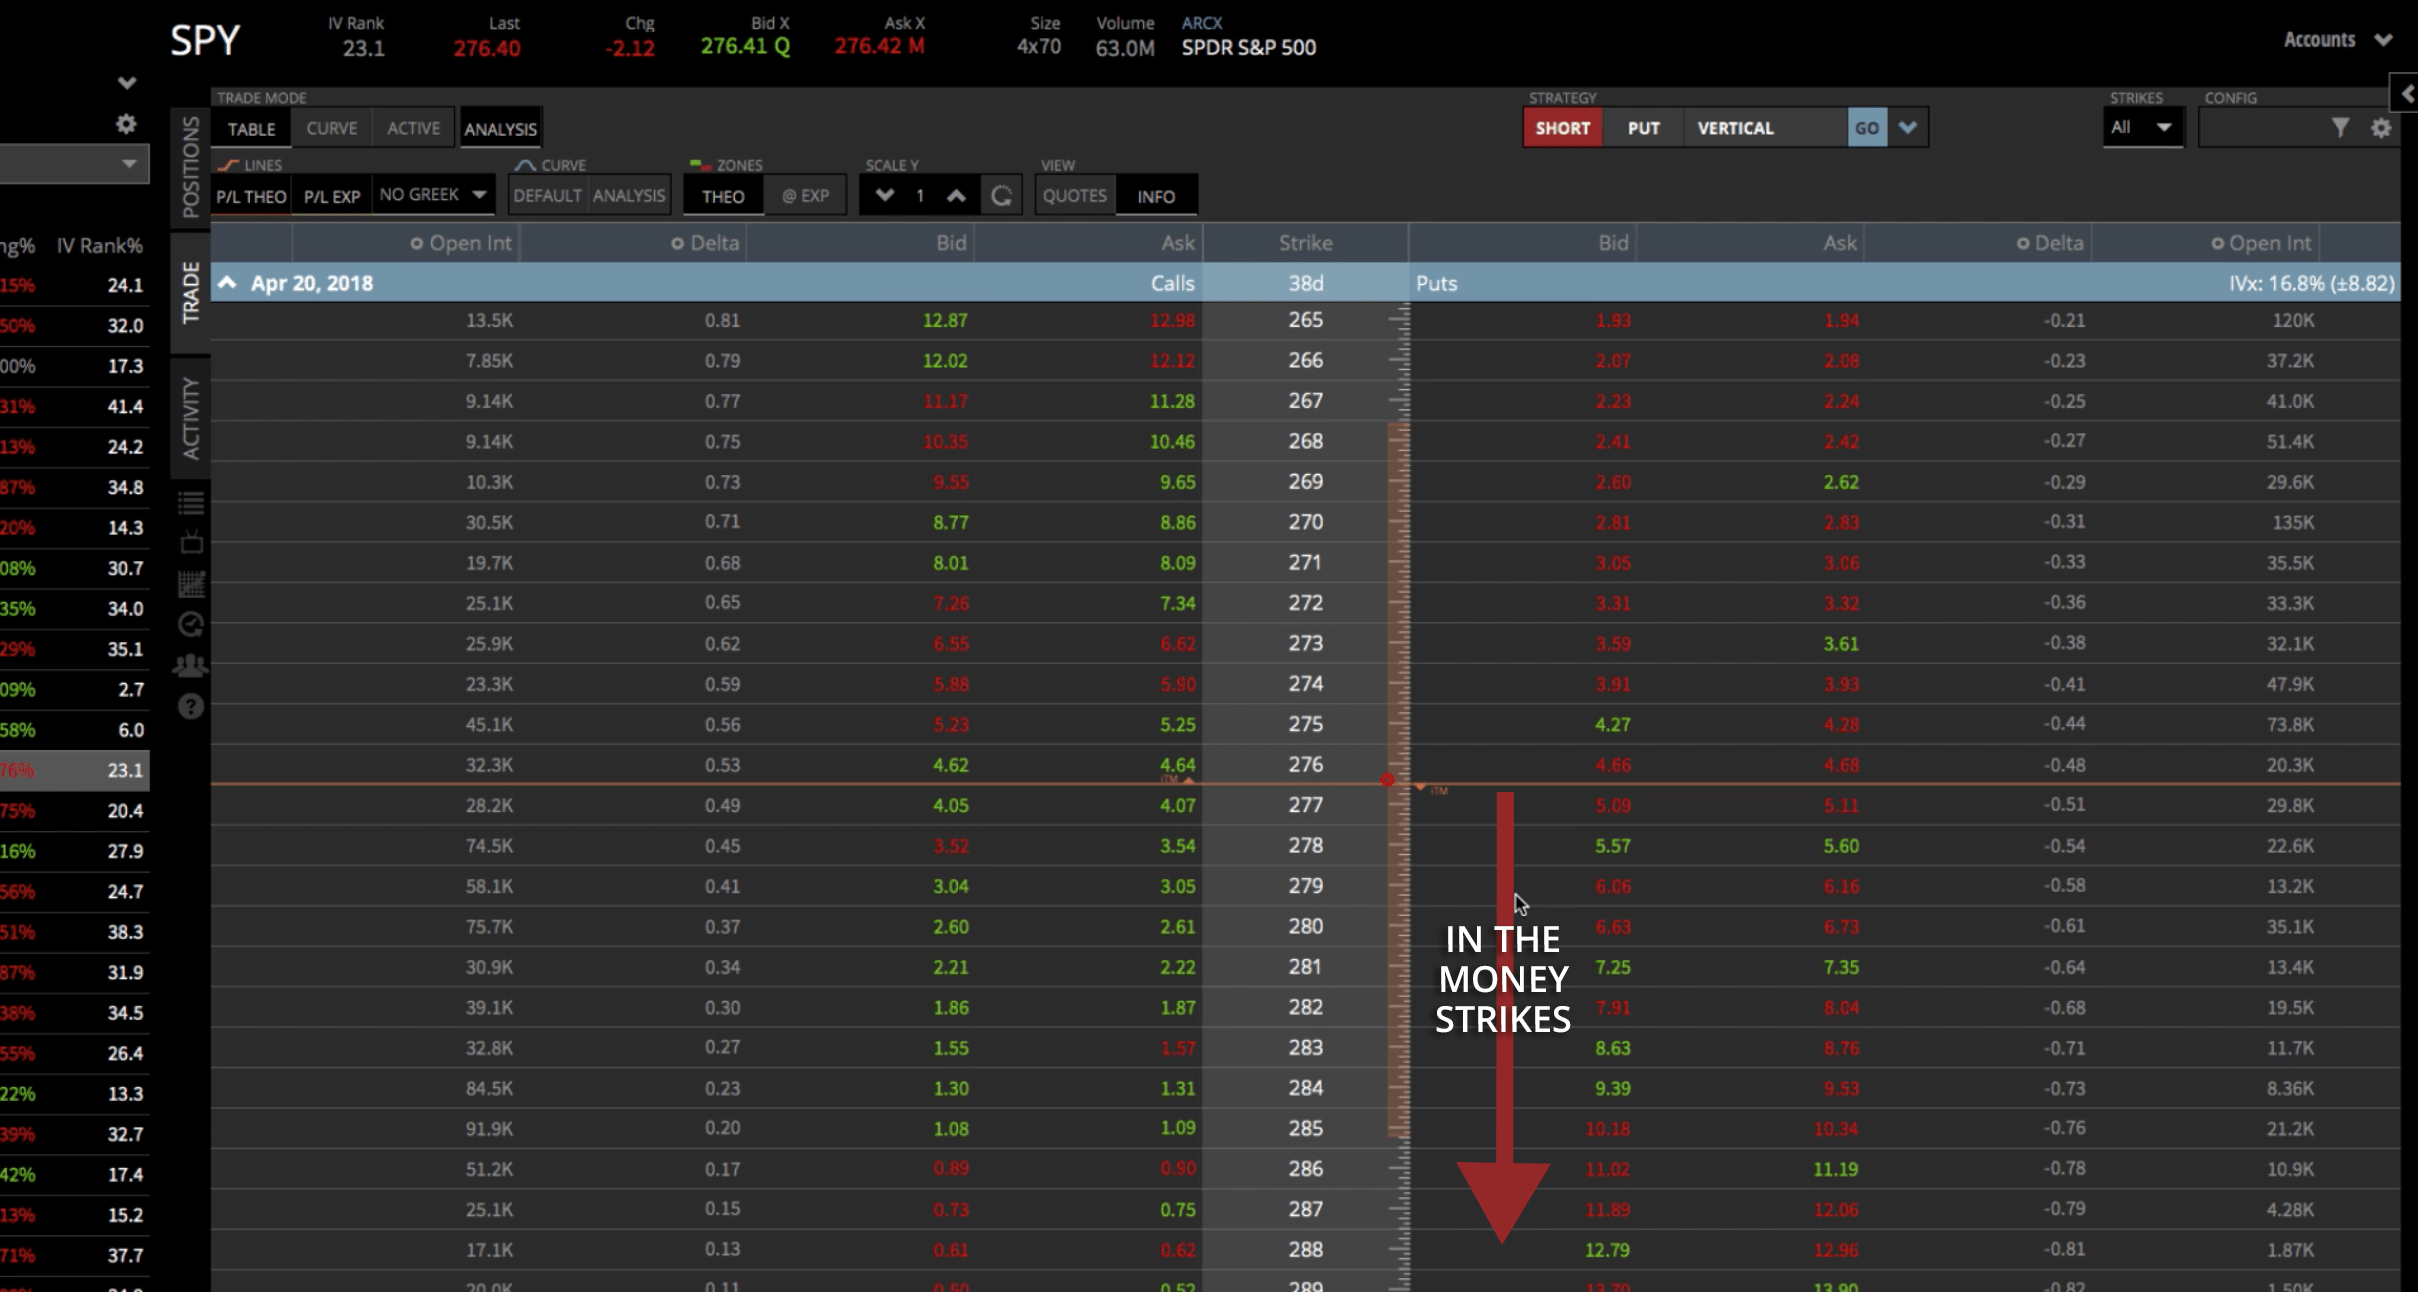
If we open up that option chain, it brings up the different strikes. We’re going to be on the put side. All we have to do is click on the bid and the ask to set up the trade.
If we’re buying a Put Vertical, we like to start with the strikes that are slightly in the money. You can see there’s an orange line running horizontally through the strikes. It’s got a little arrow and the acronym “ITM” which indicates that the strikes in that direction are in the money.

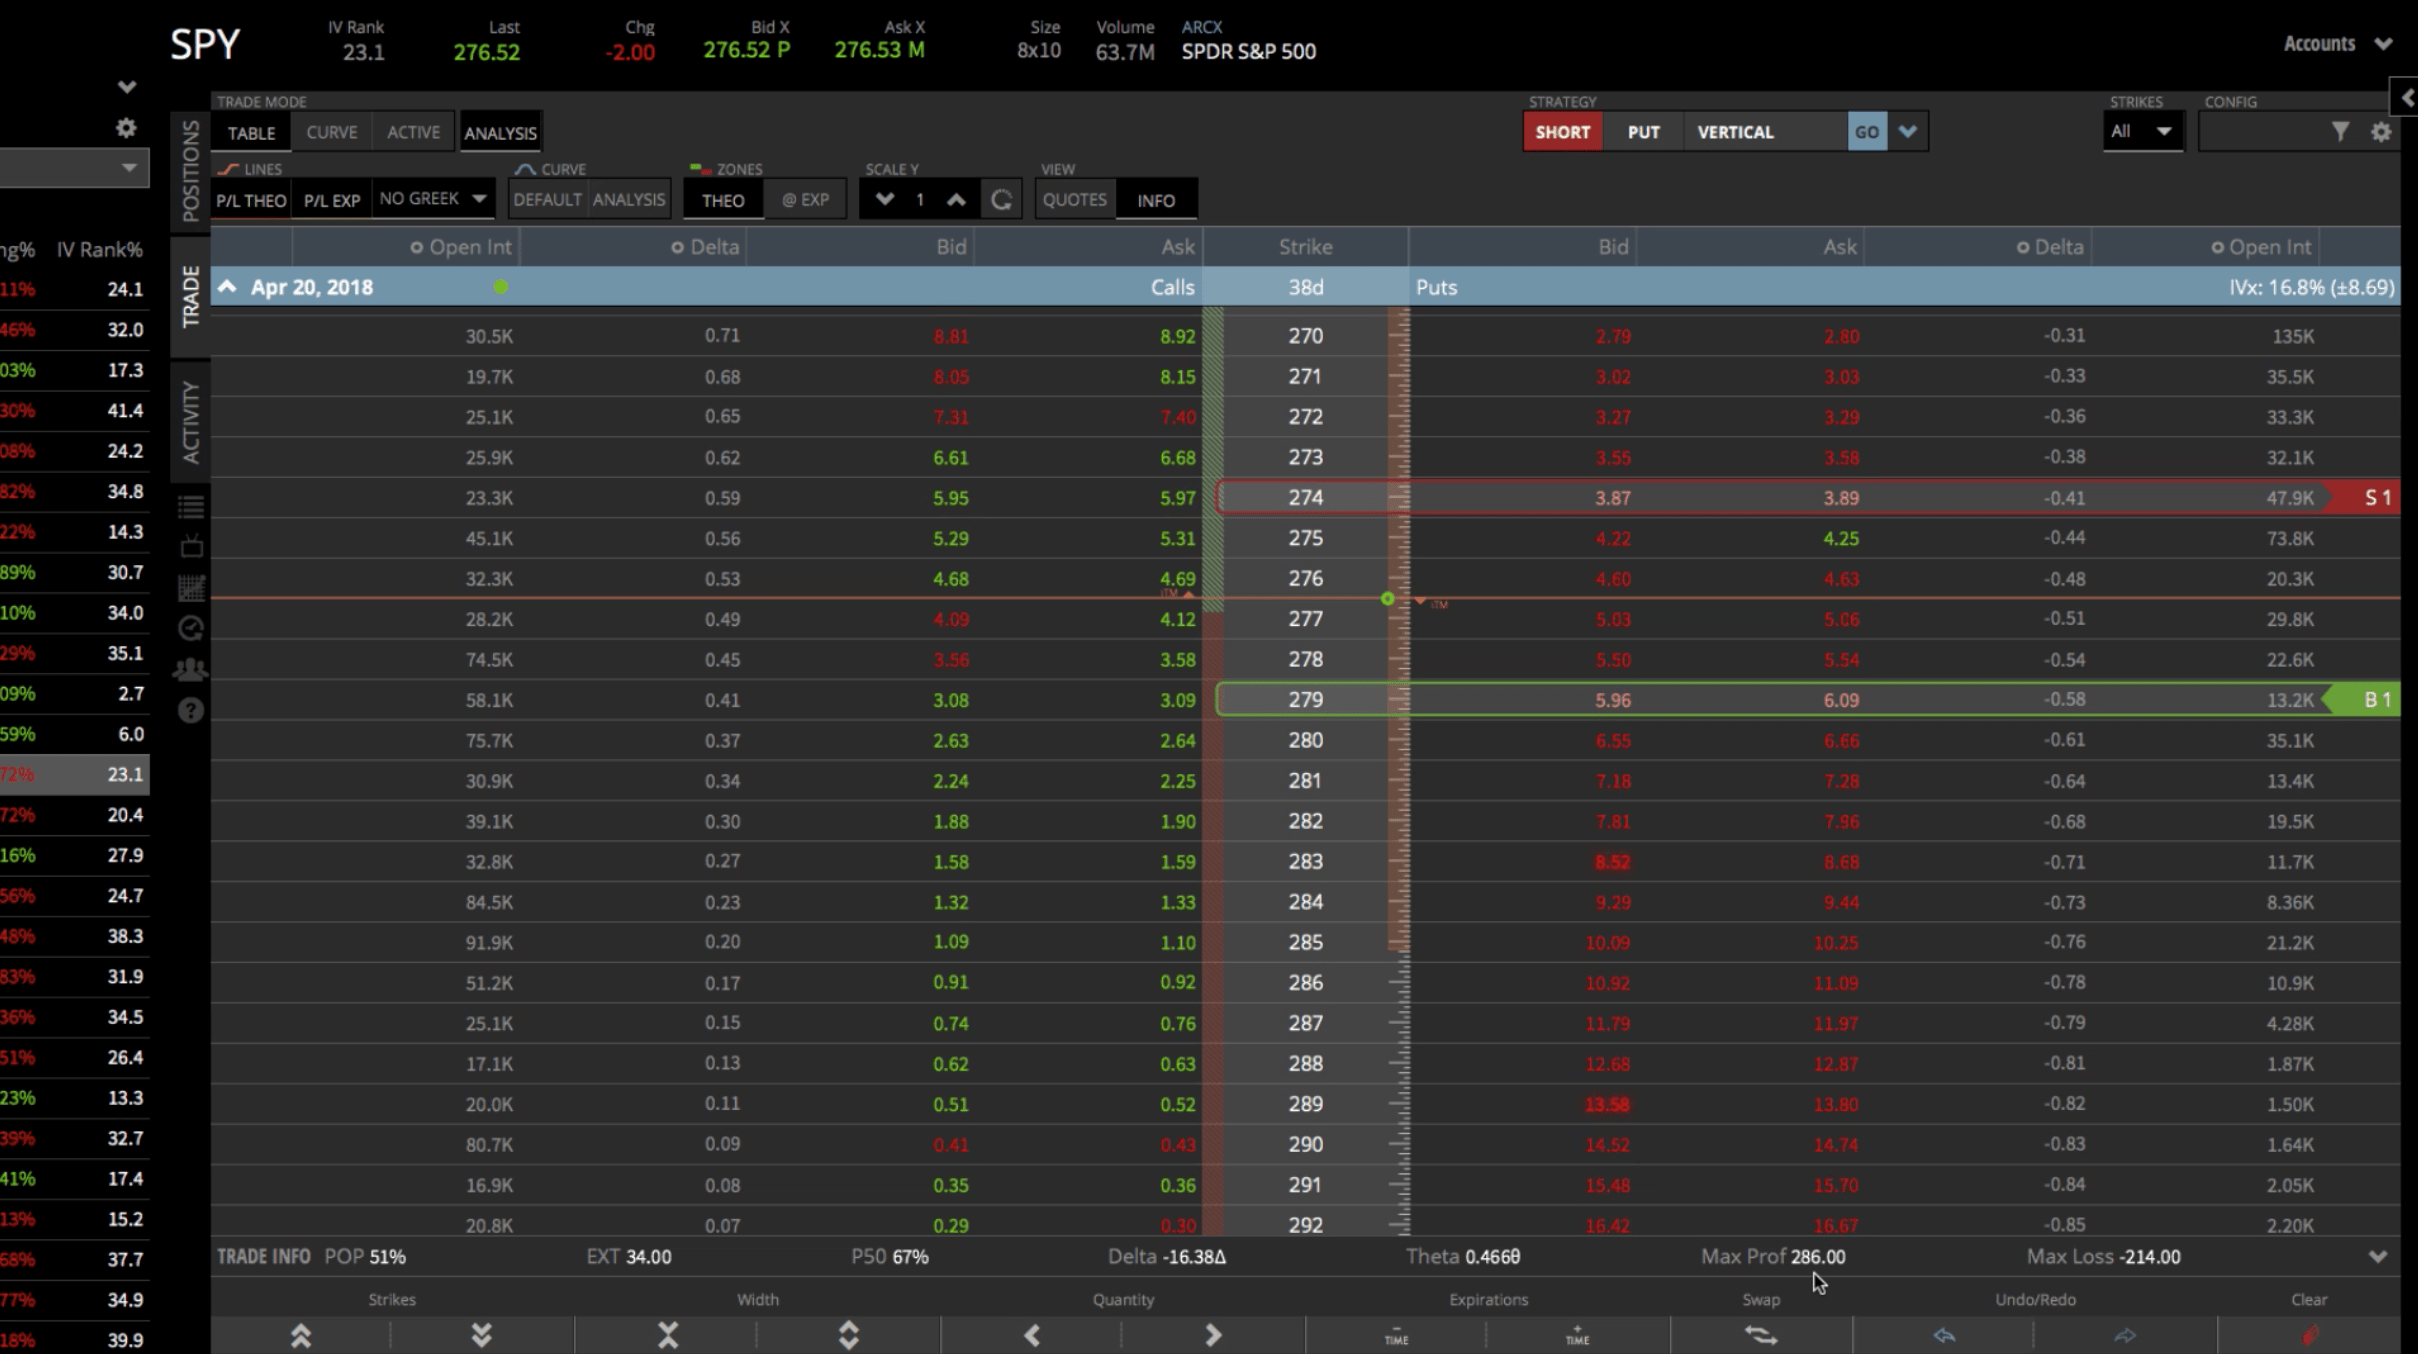
Let’s go ahead and choose a strike. We’ll do the 279. We’re going to buy the 279, so we click on the ask, and it populates. You know it’s a buy because it’s outlined in green.
Then we want to sell a strike that’s lower. Let’s go five points wide, which would be the 274 strike. Then we’ll click on the bid, which populates the sell order.
If you look at your trade information at the bottom of the platform, you can see that this trade is about a 50/50 bet.
You can see your probability of making a profit (POP) is at 51%.
The probability of making 50% (P50) of max profit is about 67%.
The delta is negative because this is a bearish trade. We’re wanting the stock to go down.
You can see your theta, your max profit at $285, and your max loss at $214.

Strategy Dropdown Method
That’s one way to set the trade up. If we clear that off, we can also utilize our Strategy dropdown menu at the top of the platform.
Remember, this is a Long Put Vertical. You’ll need to toggle the first box in the menu to “Long”, the second box to “Put”, and make “Vertical is selected from the dropdown.
That automatically populates strikes onto our screen, but those aren’t the ones we want. We wanted the 279 strike. You can just click and drag that strike over to the 279. Same thing with the 274 strike, we can just drag that up to where we want it.
Either method you choose, it’s extremely easy. Whatever your preference is, it doesn’t matter. When you use the Strategy dropdown, you’ll still see your trade information at the bottom of the platform.
If you’re happy with how the trade looks and you know all you need to know, hit “Review & Send” to get filled with your broker.

Who Doesn’t Want A Visual Representation?
I’m a visual trader, so I like to go over to the “Curve” mode tab making sure “Analysis” is highlighted. That will populate a visual graph of the trade.
You can see exactly what price you will be profitable and what price you’ll be unprofitable.
This view gives you everything you need to know with the added bonus of a visual representation. You still have your statistics down below.
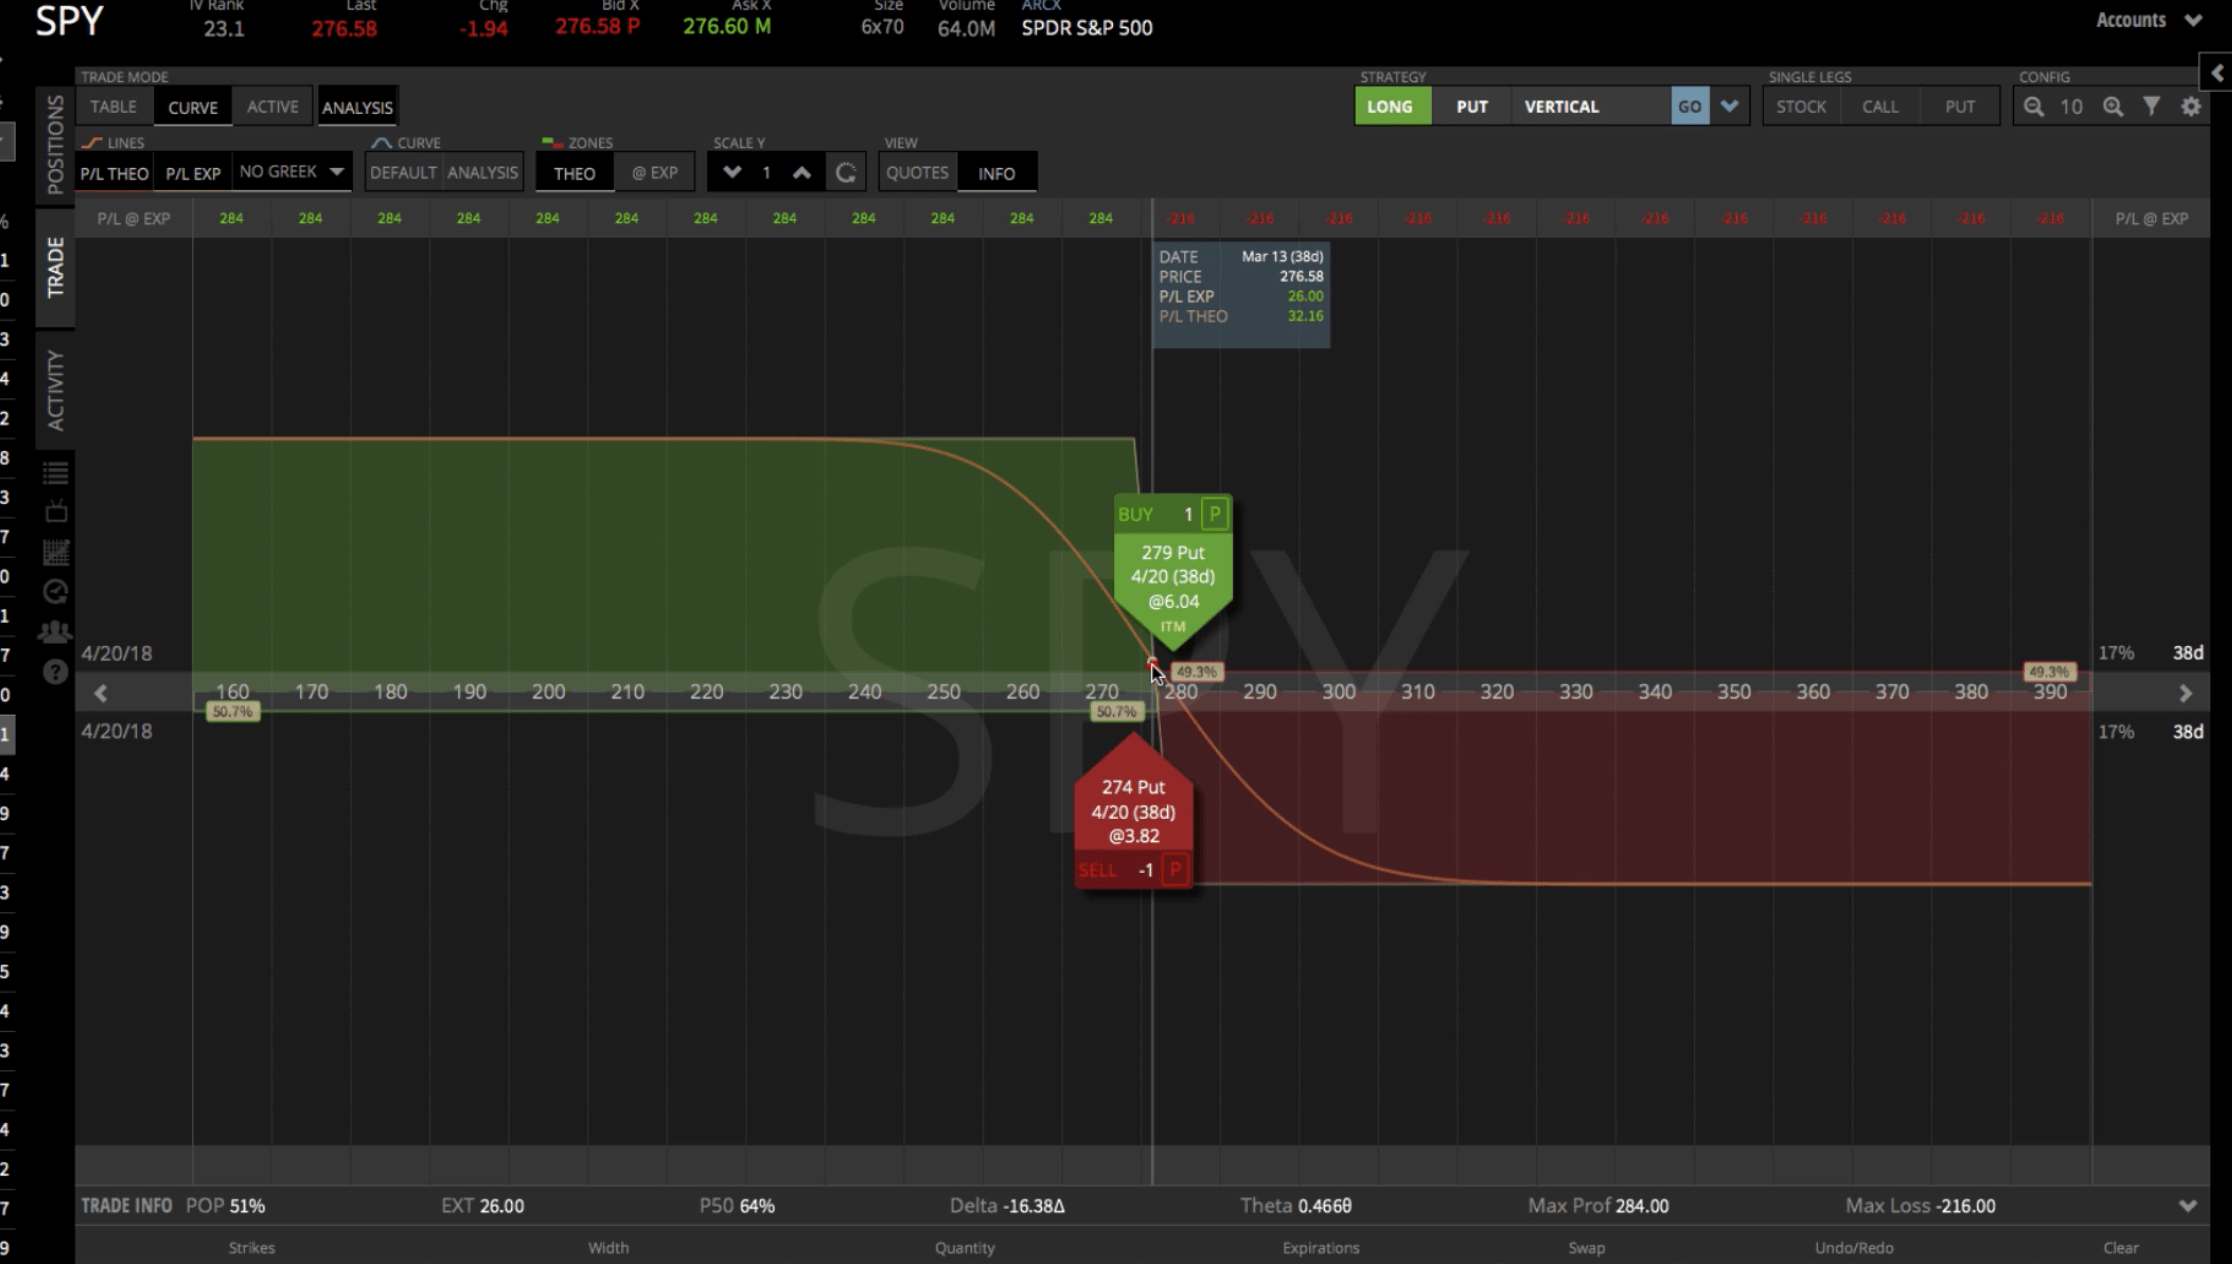

This looks okay, but let’s say you wanted to mess around and see what it would look like if you moved these strikes around. You can click and drag your long put (the green arrow tab) to the right. You can click and drag your short put (the red arrow tab) to the left. The graph gives you an idea of what your max profit and max loss would be.
Look at the little flag at the top of the graph that moves around with your cursor. If you move your mouse over to the left, you’re seeing max profit. If you move your mouse over to the right, you can see max loss. The amounts change as you’re moving your cursor.
Max profit and loss is also displayed below in the trade information section.
The visual representation of the Curve & Analysis mode helps you get a gauge of if you’re in between the max profit and max loss. You can also see exactly where your breakeven points are.
Try Simulating Your Trade
Another thing you can do is to go to the pop out window in the top left of the platform. By changing some of the values in this window, you can simulate how some variables will affect your trade.
Under “Evaluate At Date”, you can move through time. Today, at the time of this recording, it’s 3/13/2018. If you move that through time using the little arrows, you can see what happens to the P&L line.
If you wanted to vary the implied volatility, make sure you’re going down to the options in which you’re trading. In our case, it’s the 38 days to expiration. You can move the implied volatility up or down to see what that does to your P&L over time.
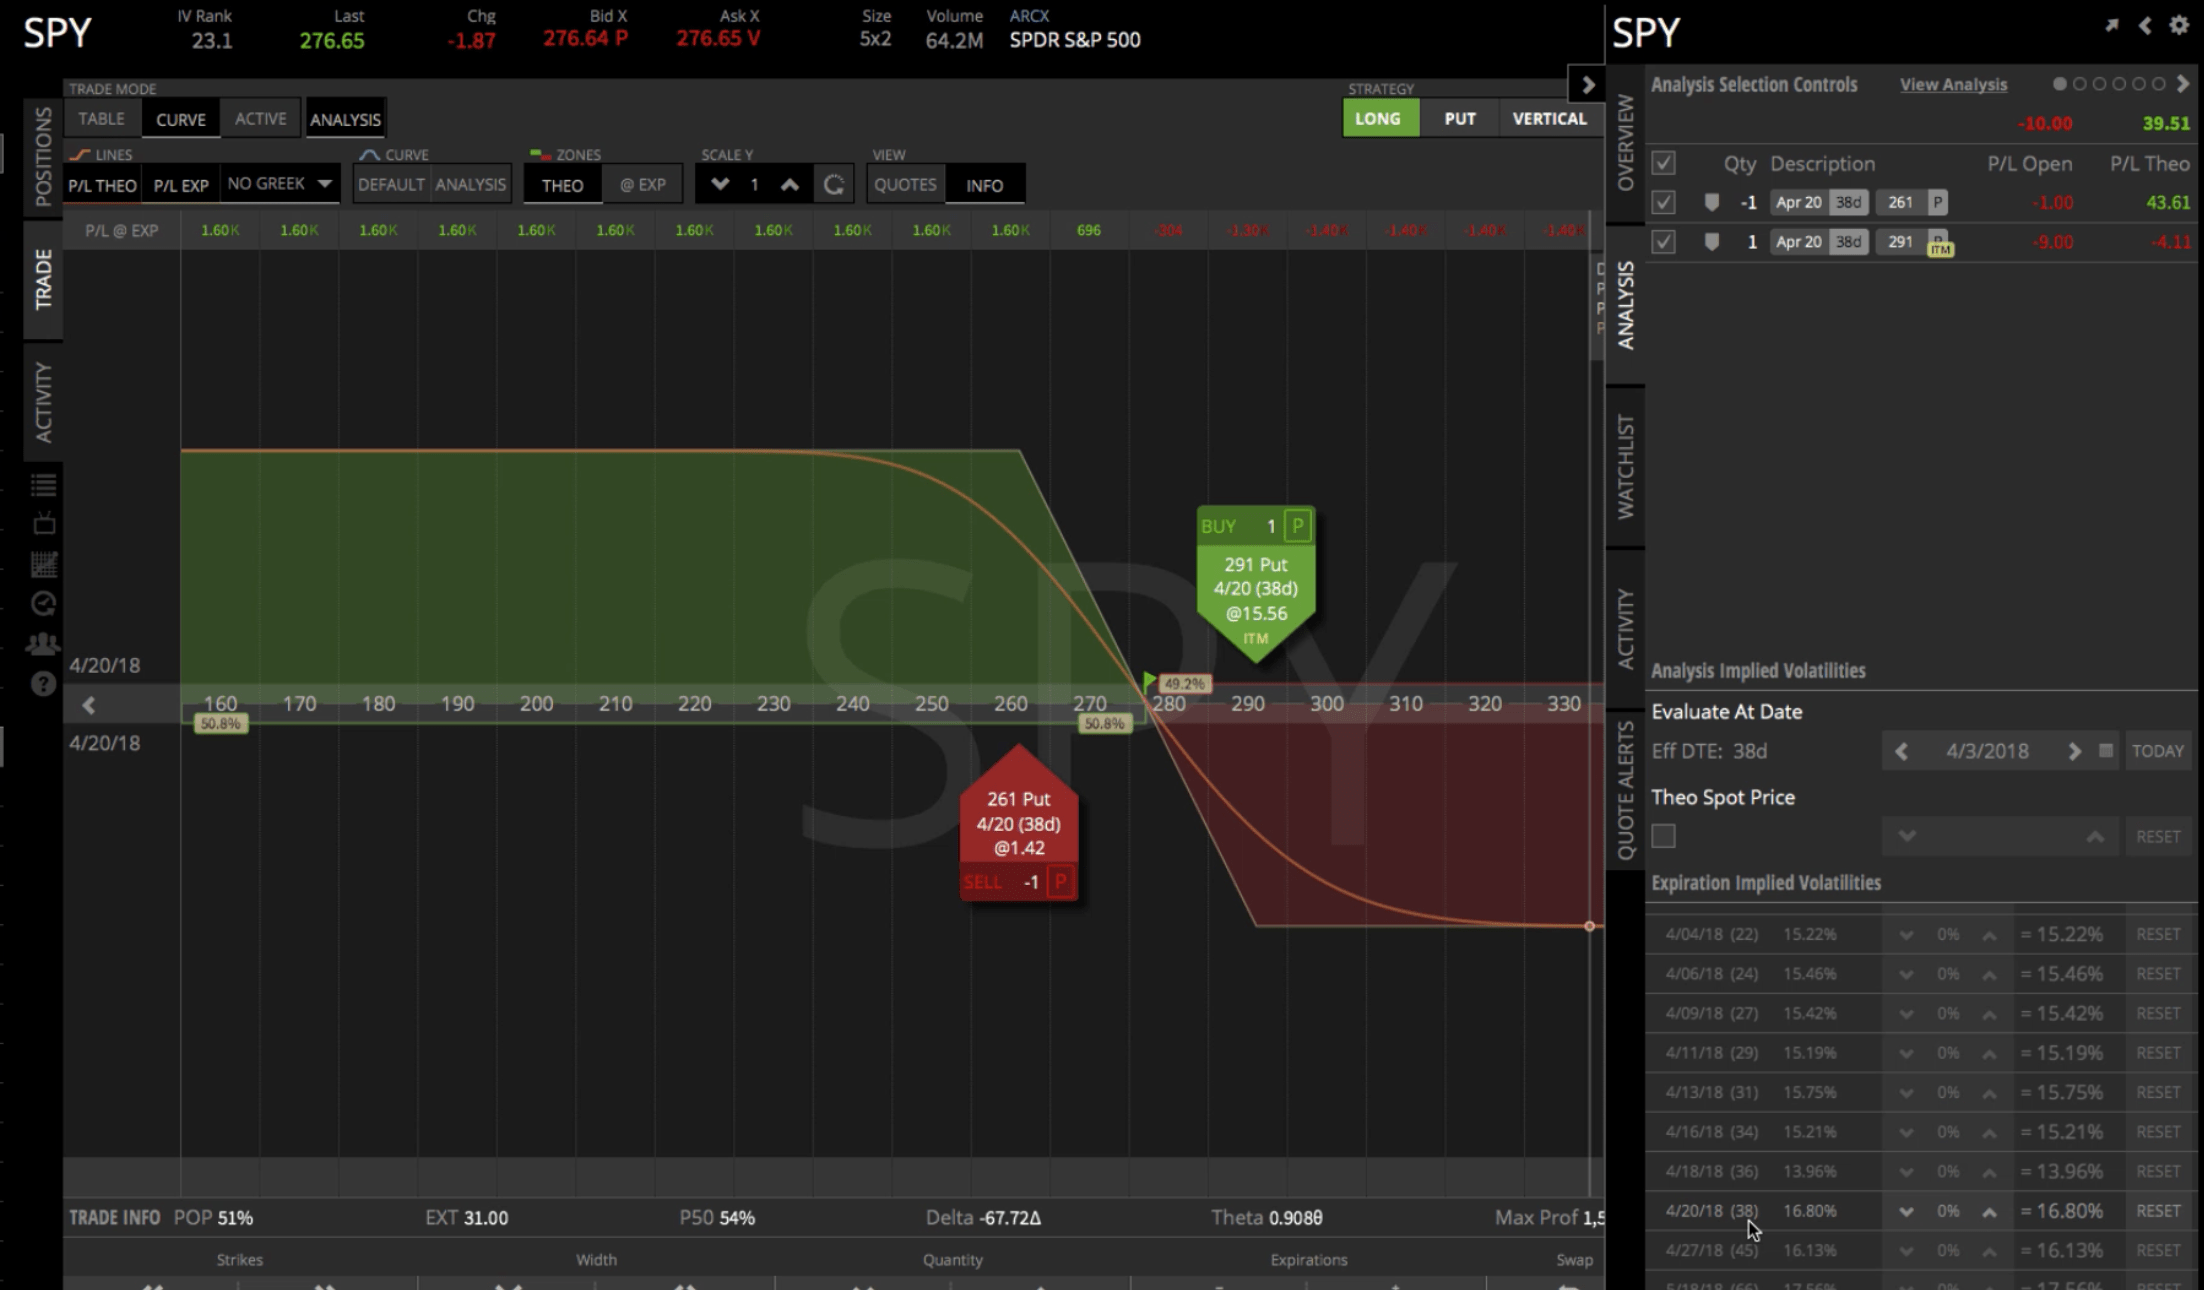

There’s a lot of great tools within tastyworks and several different ways to understand exactly what your trade looks like before you even enter it.
I hope this was helpful in showing you how to trade a Long Put Vertical in tastyworks.
Happy Trading!
tastyworks, Inc. (“tastyworks”) has entered into a Marketing Agreement with Navigation Financial, LLC (“Marketing Agent”) whereby tastyworks pays compensation to Marketing Agent to recommend tastyworks’ brokerage services. The existence of this Marketing Agreement should not be deemed as an endorsement or recommendation of Navigation Financial, LLC by tastyworks and/or any of its affiliated companies. Neither tastyworks nor any of its affiliated companies is responsible for the privacy practices of Navigation Financial, LLC or this website. tastyworks does not warrant the accuracy or content of the products or services offered by Navigation Financial, LLC or this website. Navigation Financial, LLC is independent and is not an affiliate of tasty works.

Follow