
Hey NavigationTraders!
Welcome to another lesson from navigationtrading.com!
In this lesson, we want to answer the question, “When are options expensive and when are options cheap?”.
To start, we’ll take you through a couple of examples in different symbols just to give you some perspective and an idea of what we’re talking about. When it comes to the price of an option, the amount of time that the option has until expiration and the level of its implied volatility are two of the main factors that play into whether the option’s price is actually cheap or expensive.
Netflix Vs. XLV Example
Let’s take a look at our first ticker example, which is in Netflix. If you’re on the Trade tab in most brokerage platforms (we’re in ThinkorSwim), you can see that the May monthly implied volatility is 29.81%. That’s the monthly implied volatility.
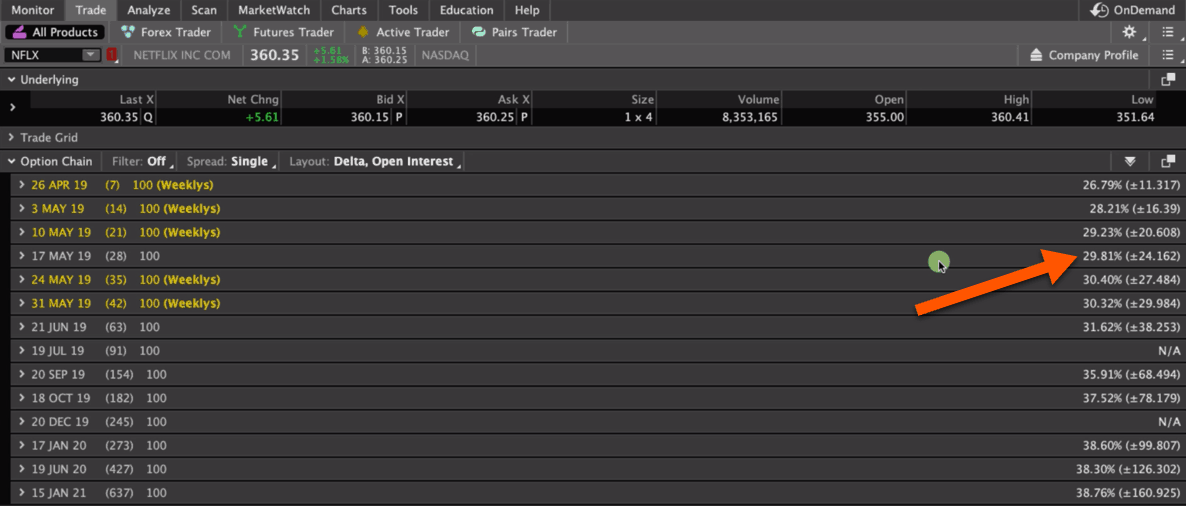

You could go out to June and see it’s about 31.62%. Those are the different monthly implied volatility levels in Netflix at this time. But, how do we know if those options are expensive or cheap?
What you have to understand is that you can’t just look at that implied volatility number and say that those options are expensive or cheap, you have to figure out what the numbers are relevant to. Are they relative to another symbol? Relative to the symbol itself? What are we comparing those to, so we can understand if those options are expensive or cheap?
Implied Volatility Indicator
At NavigationTrading, we like to compare those implied volatility numbers relative to the symbol itself over a period of time. We look at the past year and question if the implied volatility, for example in Netflix, is cheap or expensive relative to itself.
If we look at the chart of Netflix, one of the things that we use to get a quick snapshot and a visual idea of if options are cheap or expensive, is our NavigationTrading Implied Volatility Indicator. This plots two different lines. It’s got the IV rank, which is plotted in green, and the IV percentile, which is plotted in yellow.
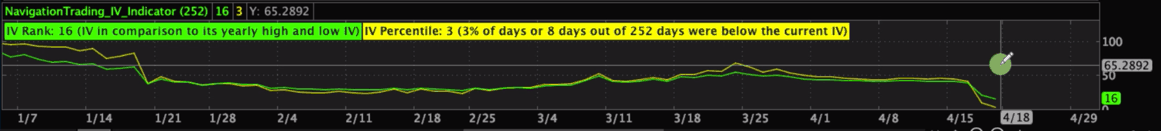

These numbers range anywhere from zero to 100. If one of the lines is above 50, then we consider that higher implied volatility because it’s higher relative to itself over the past year. That’s an easy way to find out if an option is expensive or cheap, and that’s why we’ve provided this indicator to our members.
If you were just looking at the numbers, and you were to say, “Okay, the implied volatility of Netflix is around 30.” And then you looked at another symbol, let’s say XLV, which is the Healthcare ETF, and you saw implied volatility in XLV ranges anywhere from 16-19.
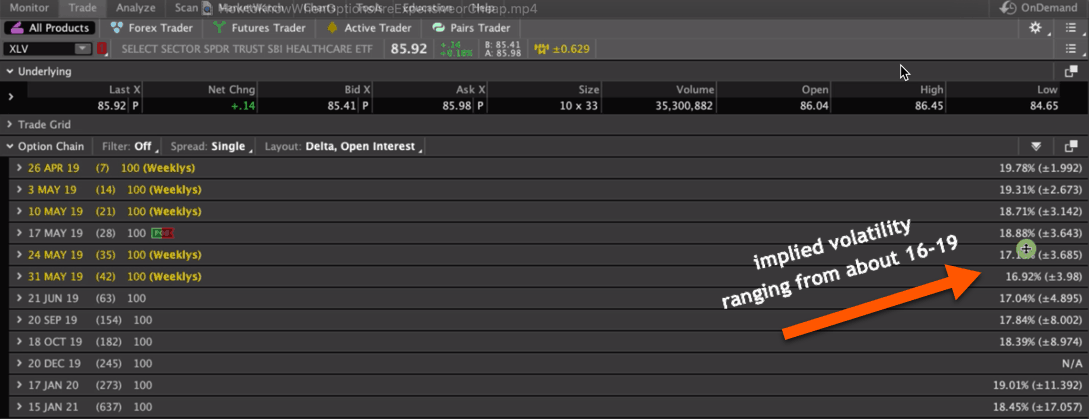

So just by looking at the numbers, you would say, “Whoa, I want to sell premium in Netflix because Netflix has higher monthly implied volatility.”
But let’s take a look at the chart of XLV. Look at the implied volatility rank and the implied volatility percentile relative to itself over the last year.
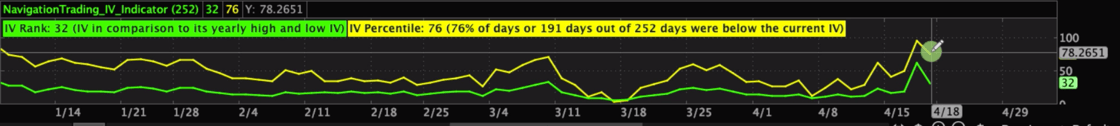

You can see the IV percentile is at 76 and the IV rank is at 32. These are actually much higher compared to Netflix, if you’re looking at it relative to itself. We would much rather be selling premium, like an Iron Condor, or an Iron Butterfly, or Strangles and Straddles in XLV, because the options are more expensive relative to itself.
Whereas, going back to Netflix, you can see relative to itself, the options are actually very cheap.
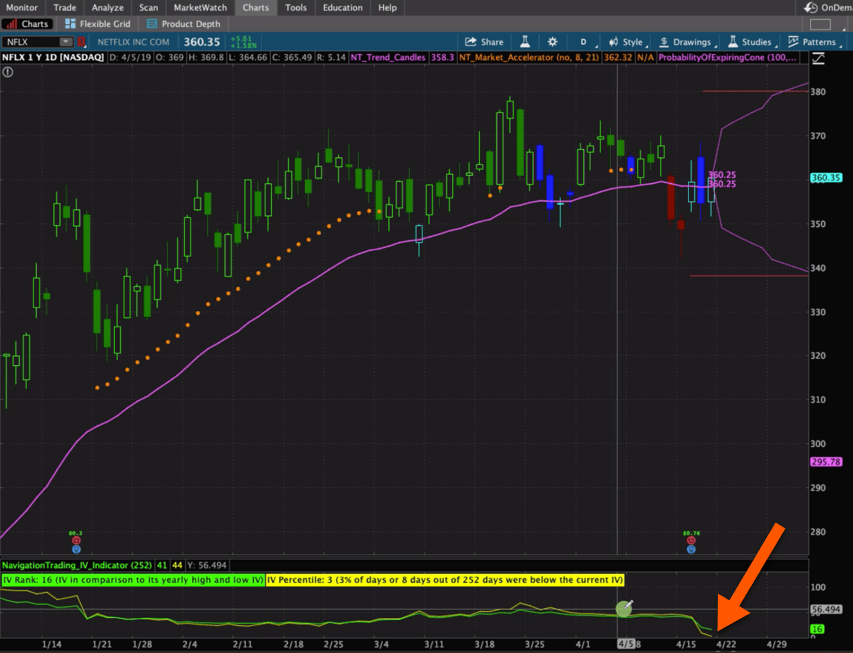

The implied volatility has contracted. So, even though the monthly implied volatility is between 28 and 31, you’ve got to look at where they are relative to themselves.
Recap
To reiterate, high implied volatility equals higher option prices, low implied volatility equals lower option prices. We want to sell options when they are more expensive, and look for that contraction of implied volatility, and that’s how we benefit.
Now, does that mean we always want to buy options when implied volatility is low? The answer is absolutely not. And newer traders ask this question a lot, because they think it just makes sense. If you sell options when implied volatility is high, then you must be able to benefit from buying options when implied volatility is low. But, that’s actually not the case. This is because, across the board, fear is typically overstated.
Uncertainty is Overstated
Uncertainty is overstated, meaning options are actually almost always overpriced. You can actually be profitable selling options when implied volatility is low, the difference is your edge is just much smaller. We just want to scale down our size a lot, to compensate for not having as much of an edge.
That’s why we want to scale up our positions, and scale up our overall capital usage when implied volatility is high in that specific symbol relative to itself, because that’s when we have the greatest probability of making the most money.
We hope this lesson was helpful!
If you are ready to get started, just click the button below. We look forward to seeing you on the inside!
Happy Trading!
-The NavigationTrading Team

Follow