
Hey NavigationTraders!
Welcome to another lesson from navigationtrading.com! In this lesson, we’ll show you how to add the implied volatility rank or IVR indicator, to your tastyworks charts.
Finding the IVR Indicator
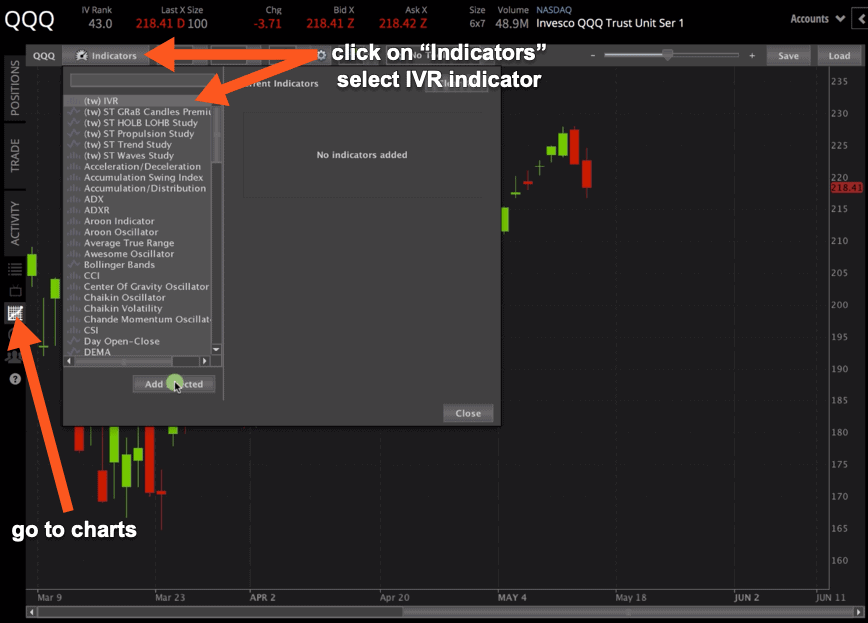
If you go to the “charts” tab, and then click on the “Indicators” button, you’ll see they just released (finally) the Implied Volatility Rank Indicator which can be added to your charts. Once you locate the IVR Indicator, it should be at the very top (at the time of this post) and select it. Then just click the “Add Selected” button and click “Close”.

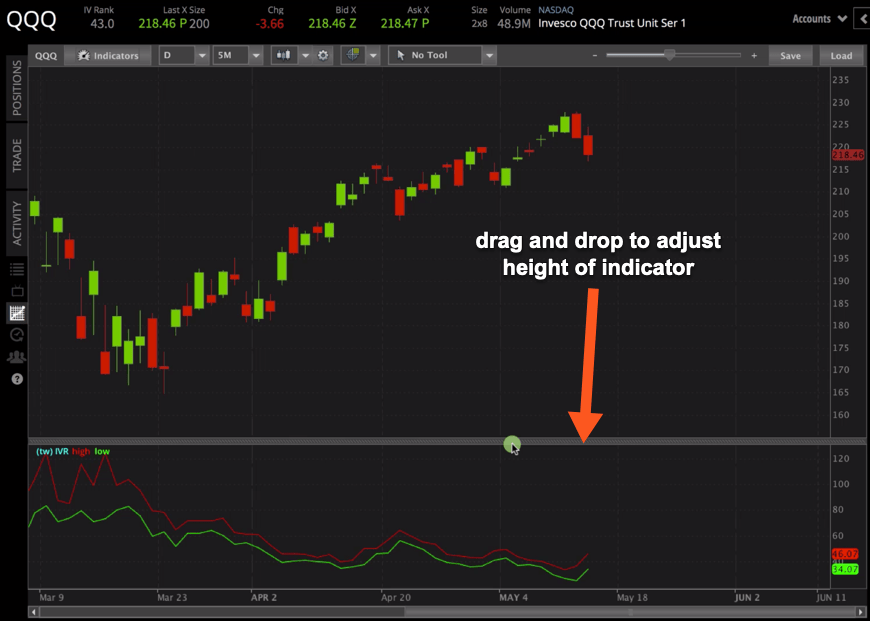
The indicator is then populated on the bottom of your chart. You can adjust the height of the indicator by dragging and dropping the top bar.

What to Expect
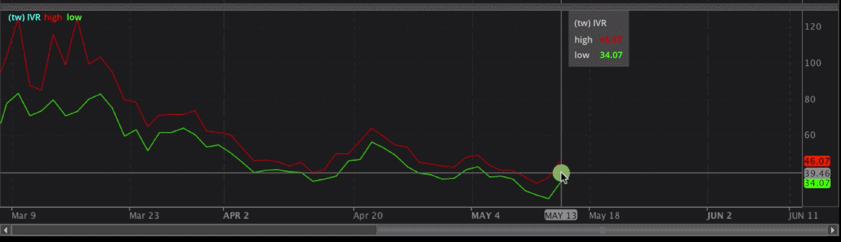
The cool thing that they’ve done with their IVR Indicator, is that it actually has two lines which show the high and the low of the implied volatility rank through time. If you look at today’s date, you can see there’s a high of 46.07, with a low of 34.07. Obviously, implied volatility has expanded today, which makes sense, because in this case, QQQ has been going lower.

They do not show the implied volatility percentile. Our NavigationTrading indicator that we use on thinkorswim, we like to plot both IV percentile and IV rank to give us a better idea of where each of them are trading. Sometimes IV rank is better to look at, but there are situations where IV percentile is going to be more accurate or provide the data that we’re looking for in relation to how expensive the options are. But it’s a step in the right direction for tastyworks. At least you now have an IVR indicator that you can put on your charts.
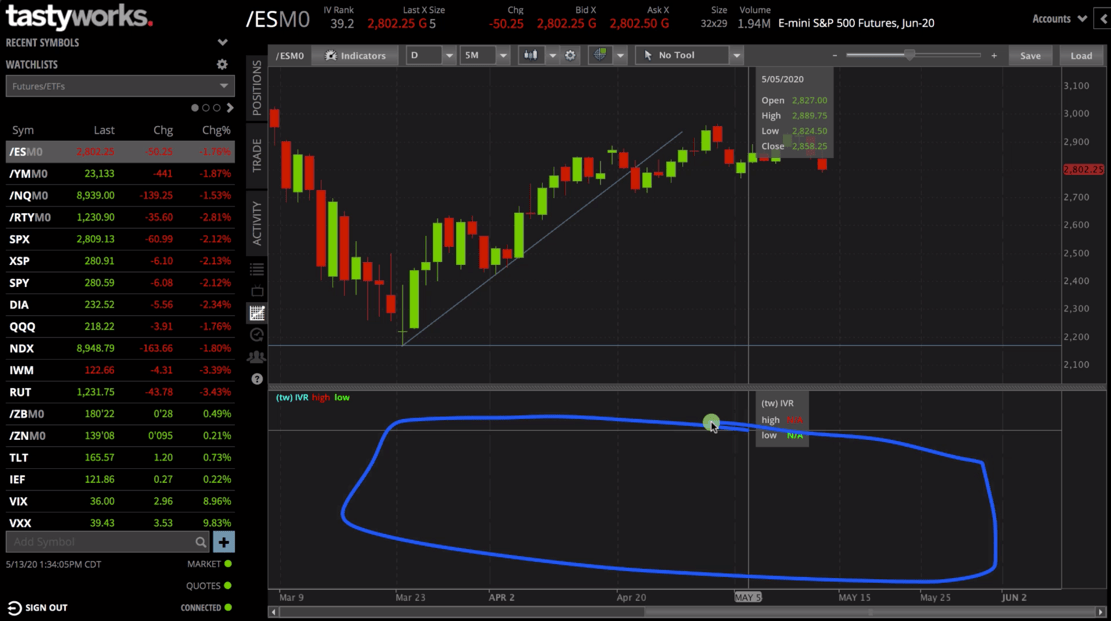
One last thing to note about tastyworks IVR Indicator…It only works with ETFs or stocks. If you try to click on a futures symbol, you’ll notice that it is blank. So it’s not available for futures yet. We have been told that it will be coming soon, but for now it works on equities, ETFs and stocks.

We hope that this lesson was helpful in showing you how to plot the implied volatility rank on your tastyworks charts. If you have any questions, drop us a line in the TradeHacker Community!
Happy Trading!
-The NavigationTrading Team

Follow